의사결정 트리를 사용하여 데이터 분류를 수행할 것이다. 데이터는 서울의 시군구, 읍면동을 사용하였고 강서, 강동, 강북, 강남으로 분류하는 작업을 실습해보았다.
데이터 불러오기
서울의 시군구 데이터는 시군구 데이터, 읍면동 데이터는 읍면동 데이터에서 가져올 수 있다. 2021.07.16부터 제공되지 않는다고 한다.
import pandas as pd
train_df = pd.read_csv('./drive/MyDrive/district_dict_list.csv')
test_df = pd.read_csv('./drive/MyDrive/dong_dict_list.csv')
train_df.head()
[출력]
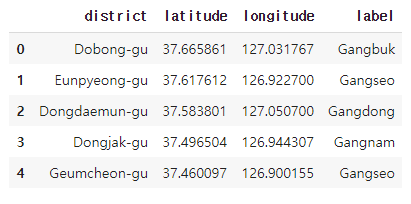
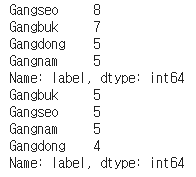
district_dict_list.csv, dong_dict_list.csv 파일은 미리 정제(cleaning) 작업을 한 파일이다. 데이터의 레이블 분포는 다음과 같다.
print(train_df.label.value_counts())
print(test_df.label.value_counts())
[출력]
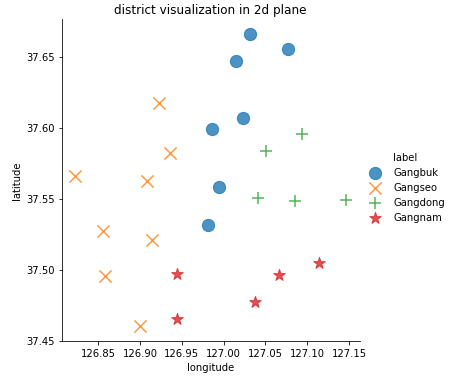
데이터 시각화
위도와 경도를 x축, y축으로 지정하여 학습 데이터를 시각화하였다.
import matplotlib.pyplot as plt
import seaborn as sns

sns.lmplot('longitude', 'latitude', data=train_df, fit_reg=False, scatter_kws={'s':150}, markers=["o", "x", "+", "*"], hue="label")
plt.title('district visualization in 2d plane')
[출력]
데이터 전처리
위에서 데이터 시각화를 보면 구 이름과 동 이름은 사용하지 않는 데이터라는 것을 확인 할 수 있다. 따라서 필요없는 구, 동 이름은 제거한다.
train_df.drop(['district'], axis=1, inplace=True)
test_df.drop(['dong'], axis=1, inplace=True)

X_train = train_df[['longitude', 'latitude']]
y_train = train_df[['label']]

X_test = test_df[['longitude', 'latitude']]
y_test = test_df[['label']]
모델 학습
from sklearn import tree, preprocessing
import numpy as np

le = preprocessing.LabelEncoder()
y_encoded = le.fit_transform(y_train)
clf = tree.DecisionTreeClassifier(max_depth = 4,
                                  min_samples_split=2,
                                  random_state=42).fit(X_train, y_encoded)
"preprocessing.LabelEncoder()"는 문자인 label값을 숫자 값으로 인코딩해주는 함수이다. 예를 들어 "강남, 강북, 강서, 강동"이라는 label이 있다면 "0, 1, 2, 3"으로 바꿔주는 것이다.
DecisionTreeClassifier의 파라미터에는 많은 것들이 있지만 그 중에 max_depth, min_samples_split, min_samples_leaf, random_state를 알아보겠다.
- max_depth : 트리의 최대 한도 깊이
- min_samples_split : 자식 노드를 갖기 위한 최소한의 데이터 개수, 간단히말해 최소 몇 번 질문할 것인지 설정하는 것이다.
- min_samples_leaf : 리프 노드의 최소 데이터 개수
- random_state : 지정한 숫자는 실질적으로 중요하지 않다. 왜냐하면 프로그램이 임의의 특정 시드를 사용해야함을 나타내기 위해 프로그램에 입력된 임의의 숫자이기 때문이다. 다시 간단히 말하면 입력한 숫자로 인해 동일한 난수 집합이 생성되는 것이다. 여기까지 이해가 안간다면 동일한 학습 결과를 도출하게 한다라는 것만 알아두면 되겠다.
의사결정 트리 시각화
◐ scatter
def display_decision_surface(clf, X, y):
  x_min = X.longitude.min() - 0.01
  x_max = X.longitude.max() + 0.01
  y_min = X.latitude.min() - 0.01
  y_max = X.latitude.max() + 0.01

  n_classes = len(le.classes_)
  plot_colors = 'rywb'
  plot_step = 0.001

  xx, yy = np.meshgrid(np.arange(x_min, x_max, plot_step),
                       np.arange(y_min, y_max, plot_step))

  Z = clf.predict(np.c_[xx.ravel(), yy.ravel()])
  Z = Z.reshape(xx.shape)
  cs = plt.contourf(xx, yy, Z, cmap=plt.cm.RdYlBu)

  for i, color in zip(range(n_classes), plot_colors):
    idx = np.where(y == i)
    plt.scatter(X.loc[idx].longitude, X.loc[idx].latitude,
                c = color, label = le.classes_[i],
                cmap = plt.cm.RdYlBu, edgecolor = 'black', s=200)

  plt.title('Decision surface of a decision tree', fontsize=16)
  plt.legend(bbox_to_anchor=(1.05, 1),
             loc=2, borderaxespad=0., fontsize=14)
  plt.xlabel('longitude', fontsize=16)
  plt.ylabel('latitude', fontsize=16)
  plt.rcParams["figure.figsize"] = [7, 5]
  plt.rcParams["font.size"] = 14
  plt.rcParams["xtick.labelsize"] = 14
  plt.rcParams["ytick.labelsize"] = 14
  plt.show()
display_decision_surface(clf, X_train, y_encoded)
[출력]
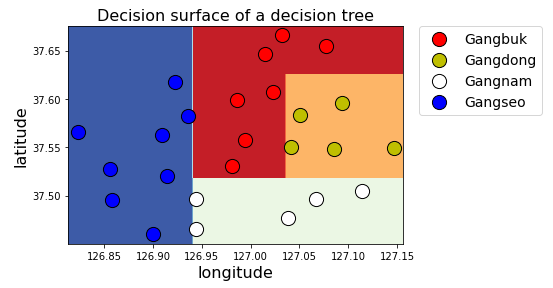
overfitting이 일어나게된다면 DecisionTreeClassifier의 파라미터들을 조정해주면 된다.
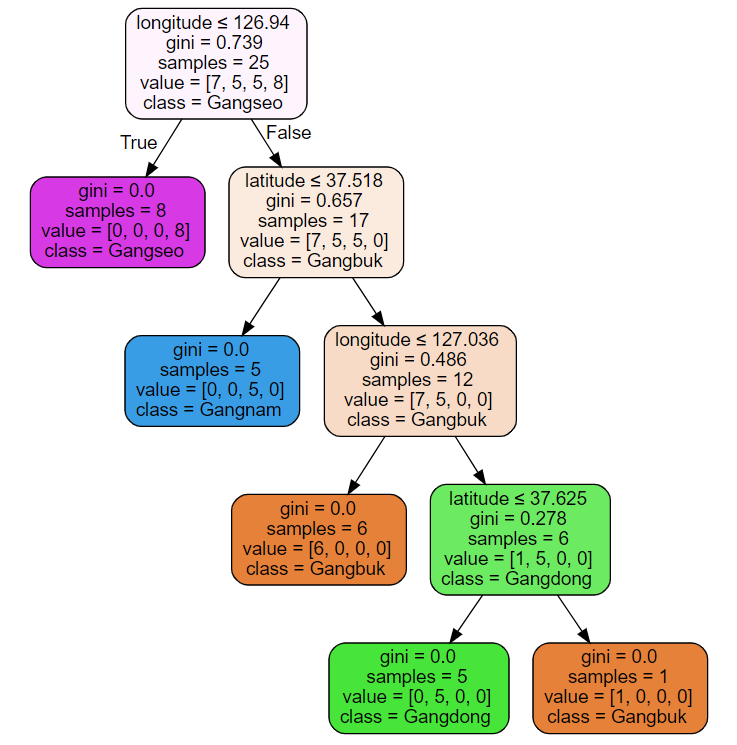
◑ graphviz
import graphviz
dot_data = tree.export_graphviz(clf, out_file=None)
graph = graphviz.Source(dot_data)
graph.render('seoul')
dot_data = tree.export_graphviz(clf, out_file=None,
                                feature_names=['longitude', 'latitude'],
                                class_names=['Gangbuk', 'Gangdong', 'Gangnam', 'Gangseo'],
                                filled=True, rounded=True,
                                special_characters=True)
graph = graphviz.Source(dot_data)
graph
[출력]
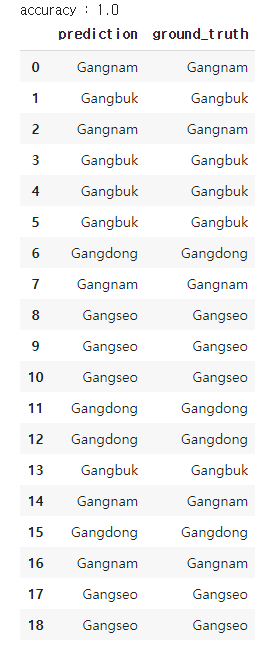
모델 테스트
from sklearn.metrics import accuracy_score
pred = clf.predict(X_test)
print("accuracy :", str(accuracy_score(y_test.values.ravel(), le.classes_[pred])))

comparison = pd.DataFrame({'prediction':le.classes_[pred],
                           'ground_truth':y_test.values.ravel()})
comparison
[출력]
'Machine Learning > Coding' 카테고리의 다른 글
| [실습]Bernoulli Naive Bayes(베르누이 나이브 베이즈) (0) | 2021.06.10 |
|---|---|
| [실습] Gaussian Naive Bayes(가우시안 나이브 베이즈) (0) | 2021.06.07 |
| [실습]SVM(Support Vector Machine) (2) | 2021.05.27 |
| [실습] k-최근접 이웃(k-Nearest Neighbor, kNN) (0) | 2021.05.22 |
| COVID-19 데이터 가공 및 시각화 (0) | 2021.05.20 |