프로메테우스 설치 및 실행
- brew install prometheus -> 설치
- brew services start prometheus -> 실행
- ps -ax | grep prometheus -> prometheus.yml 위치 확인
- prometheus.yml에 설정된 호스트 주소로 접속
Spring Dependency
- 의존성 추가
implementation 'org.springframework.boot:spring-boot-starter-actuator'
implementation 'io.micrometer:micrometer-core'
runtimeOnly 'io.micrometer:micrometer-registry-prometheus'- properties 설정
management:
  server:
    port: 8090
  endpoints:
    web:
      exposure: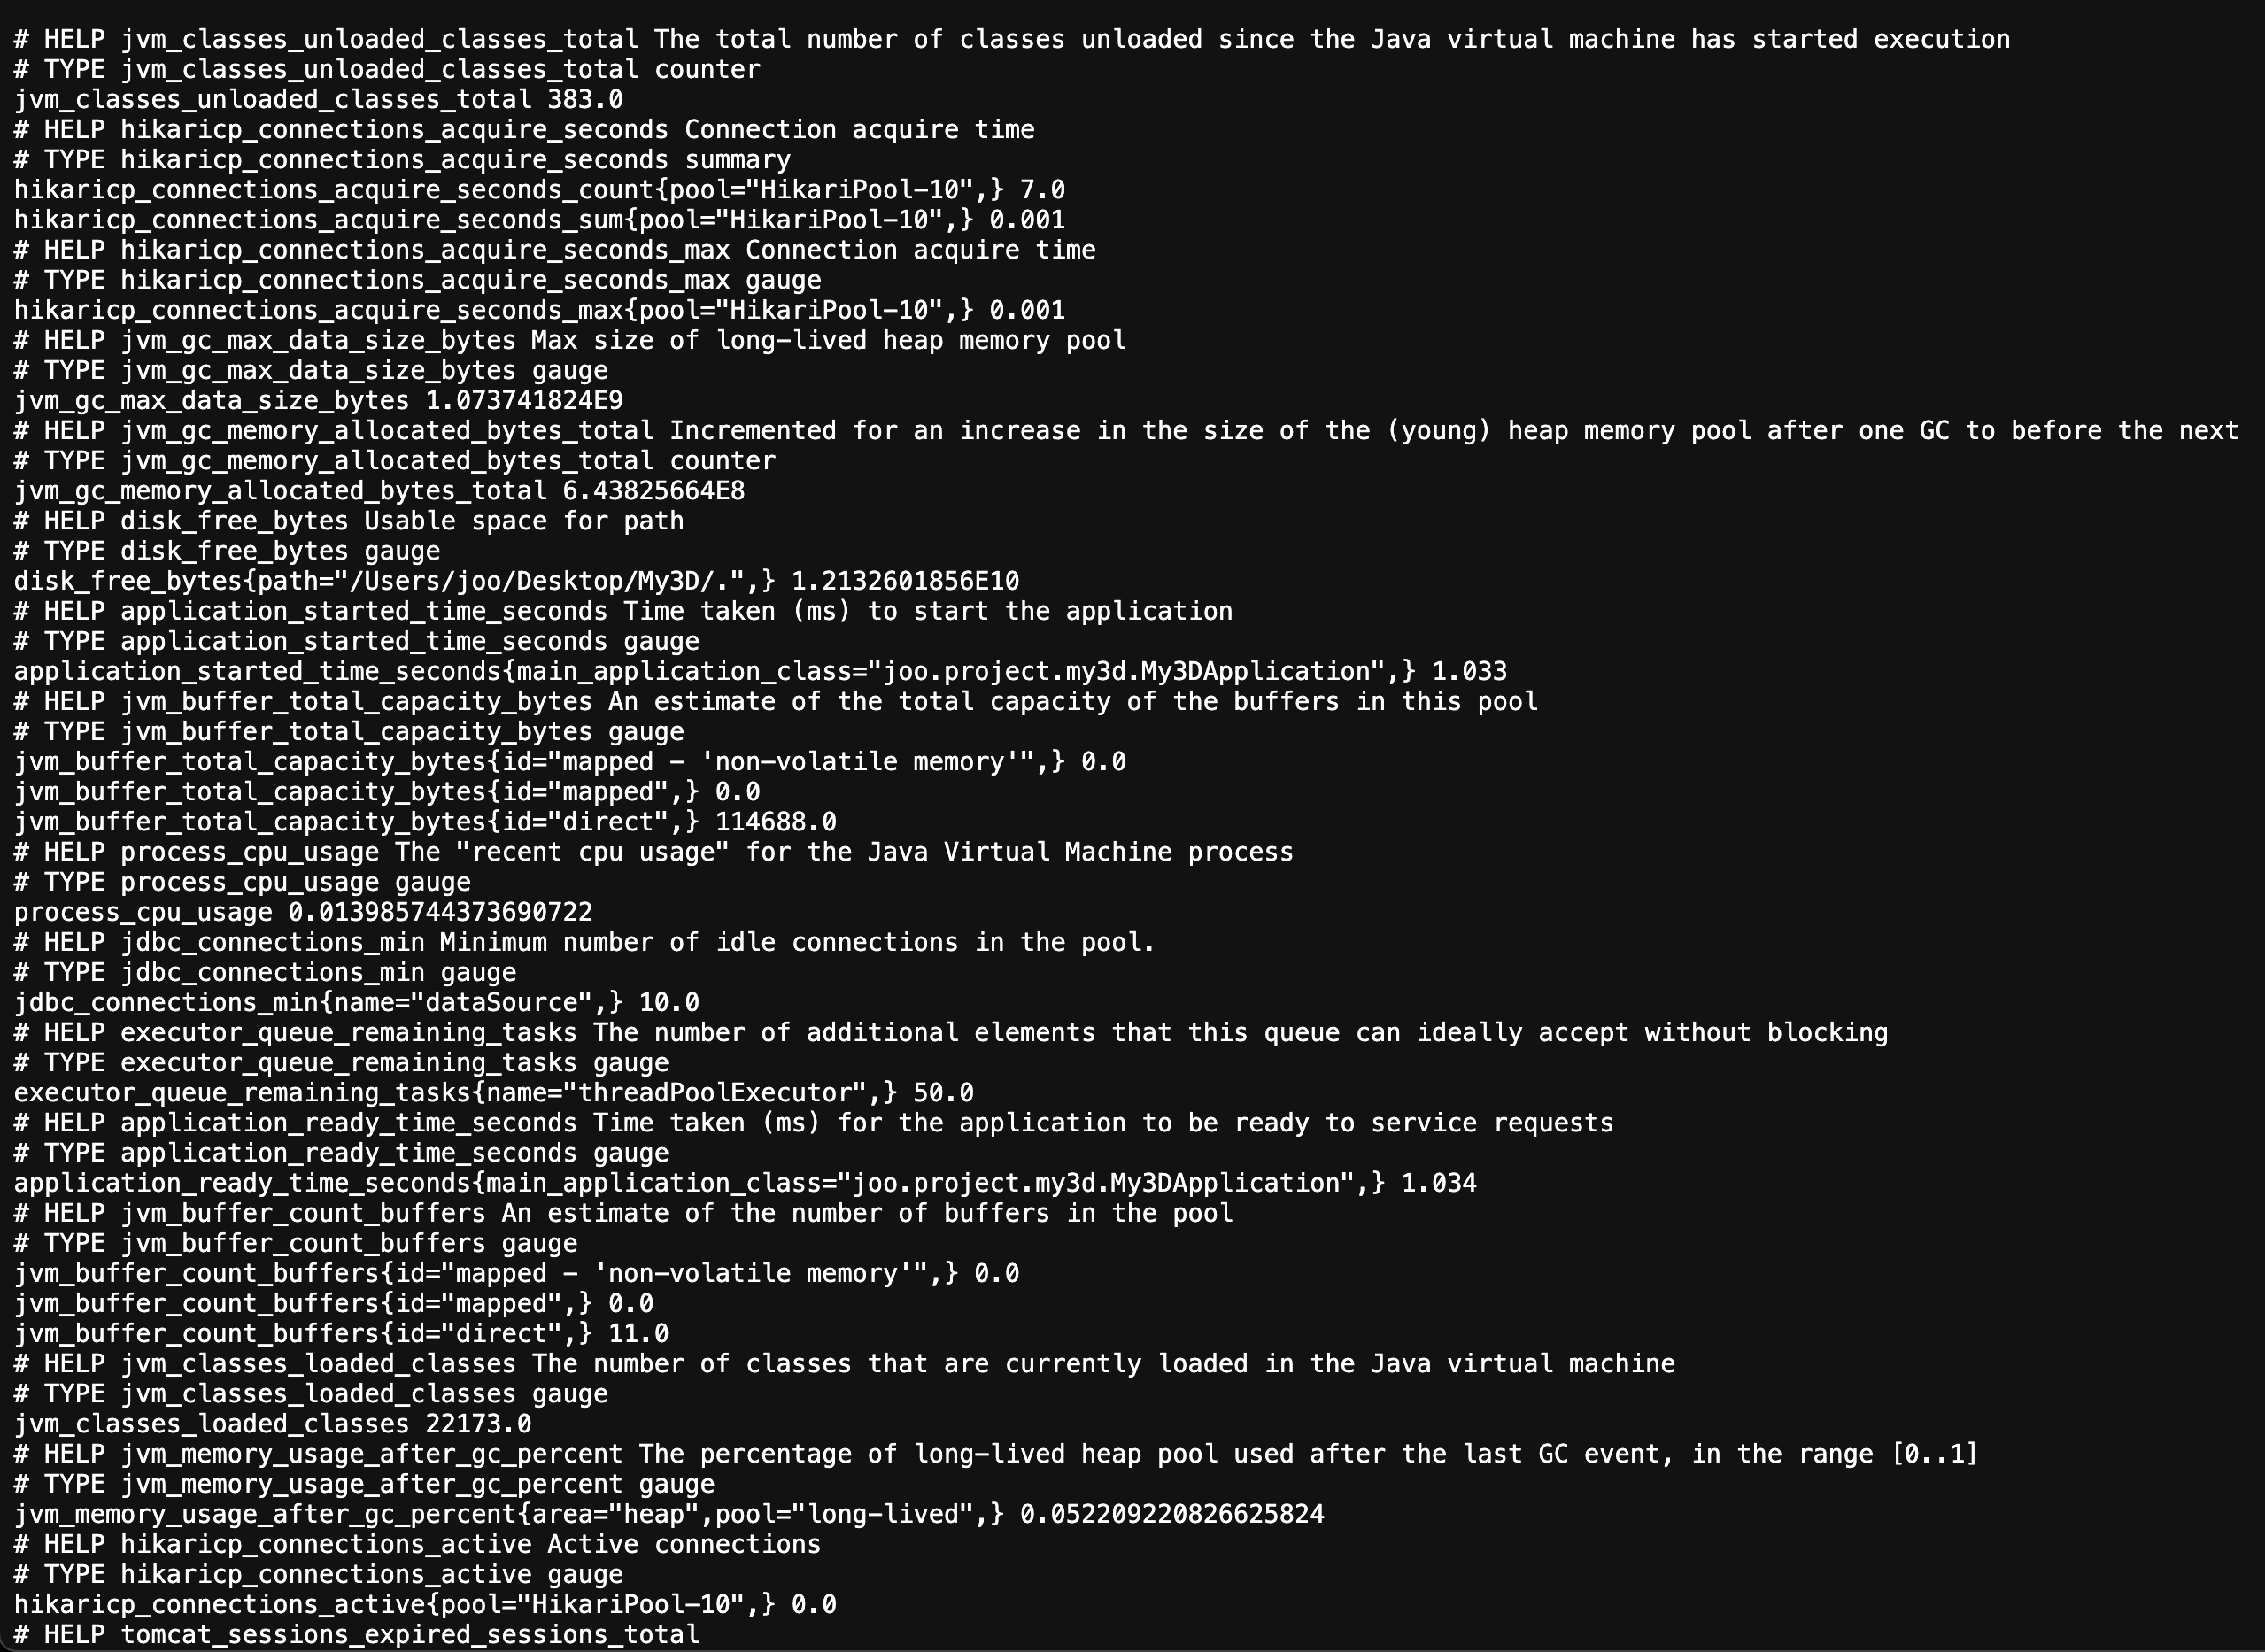
include: "prometheus"- http://localhost:8090/actuator/prometheus 접속하면 다음과같이 metric 정보가 나온다.
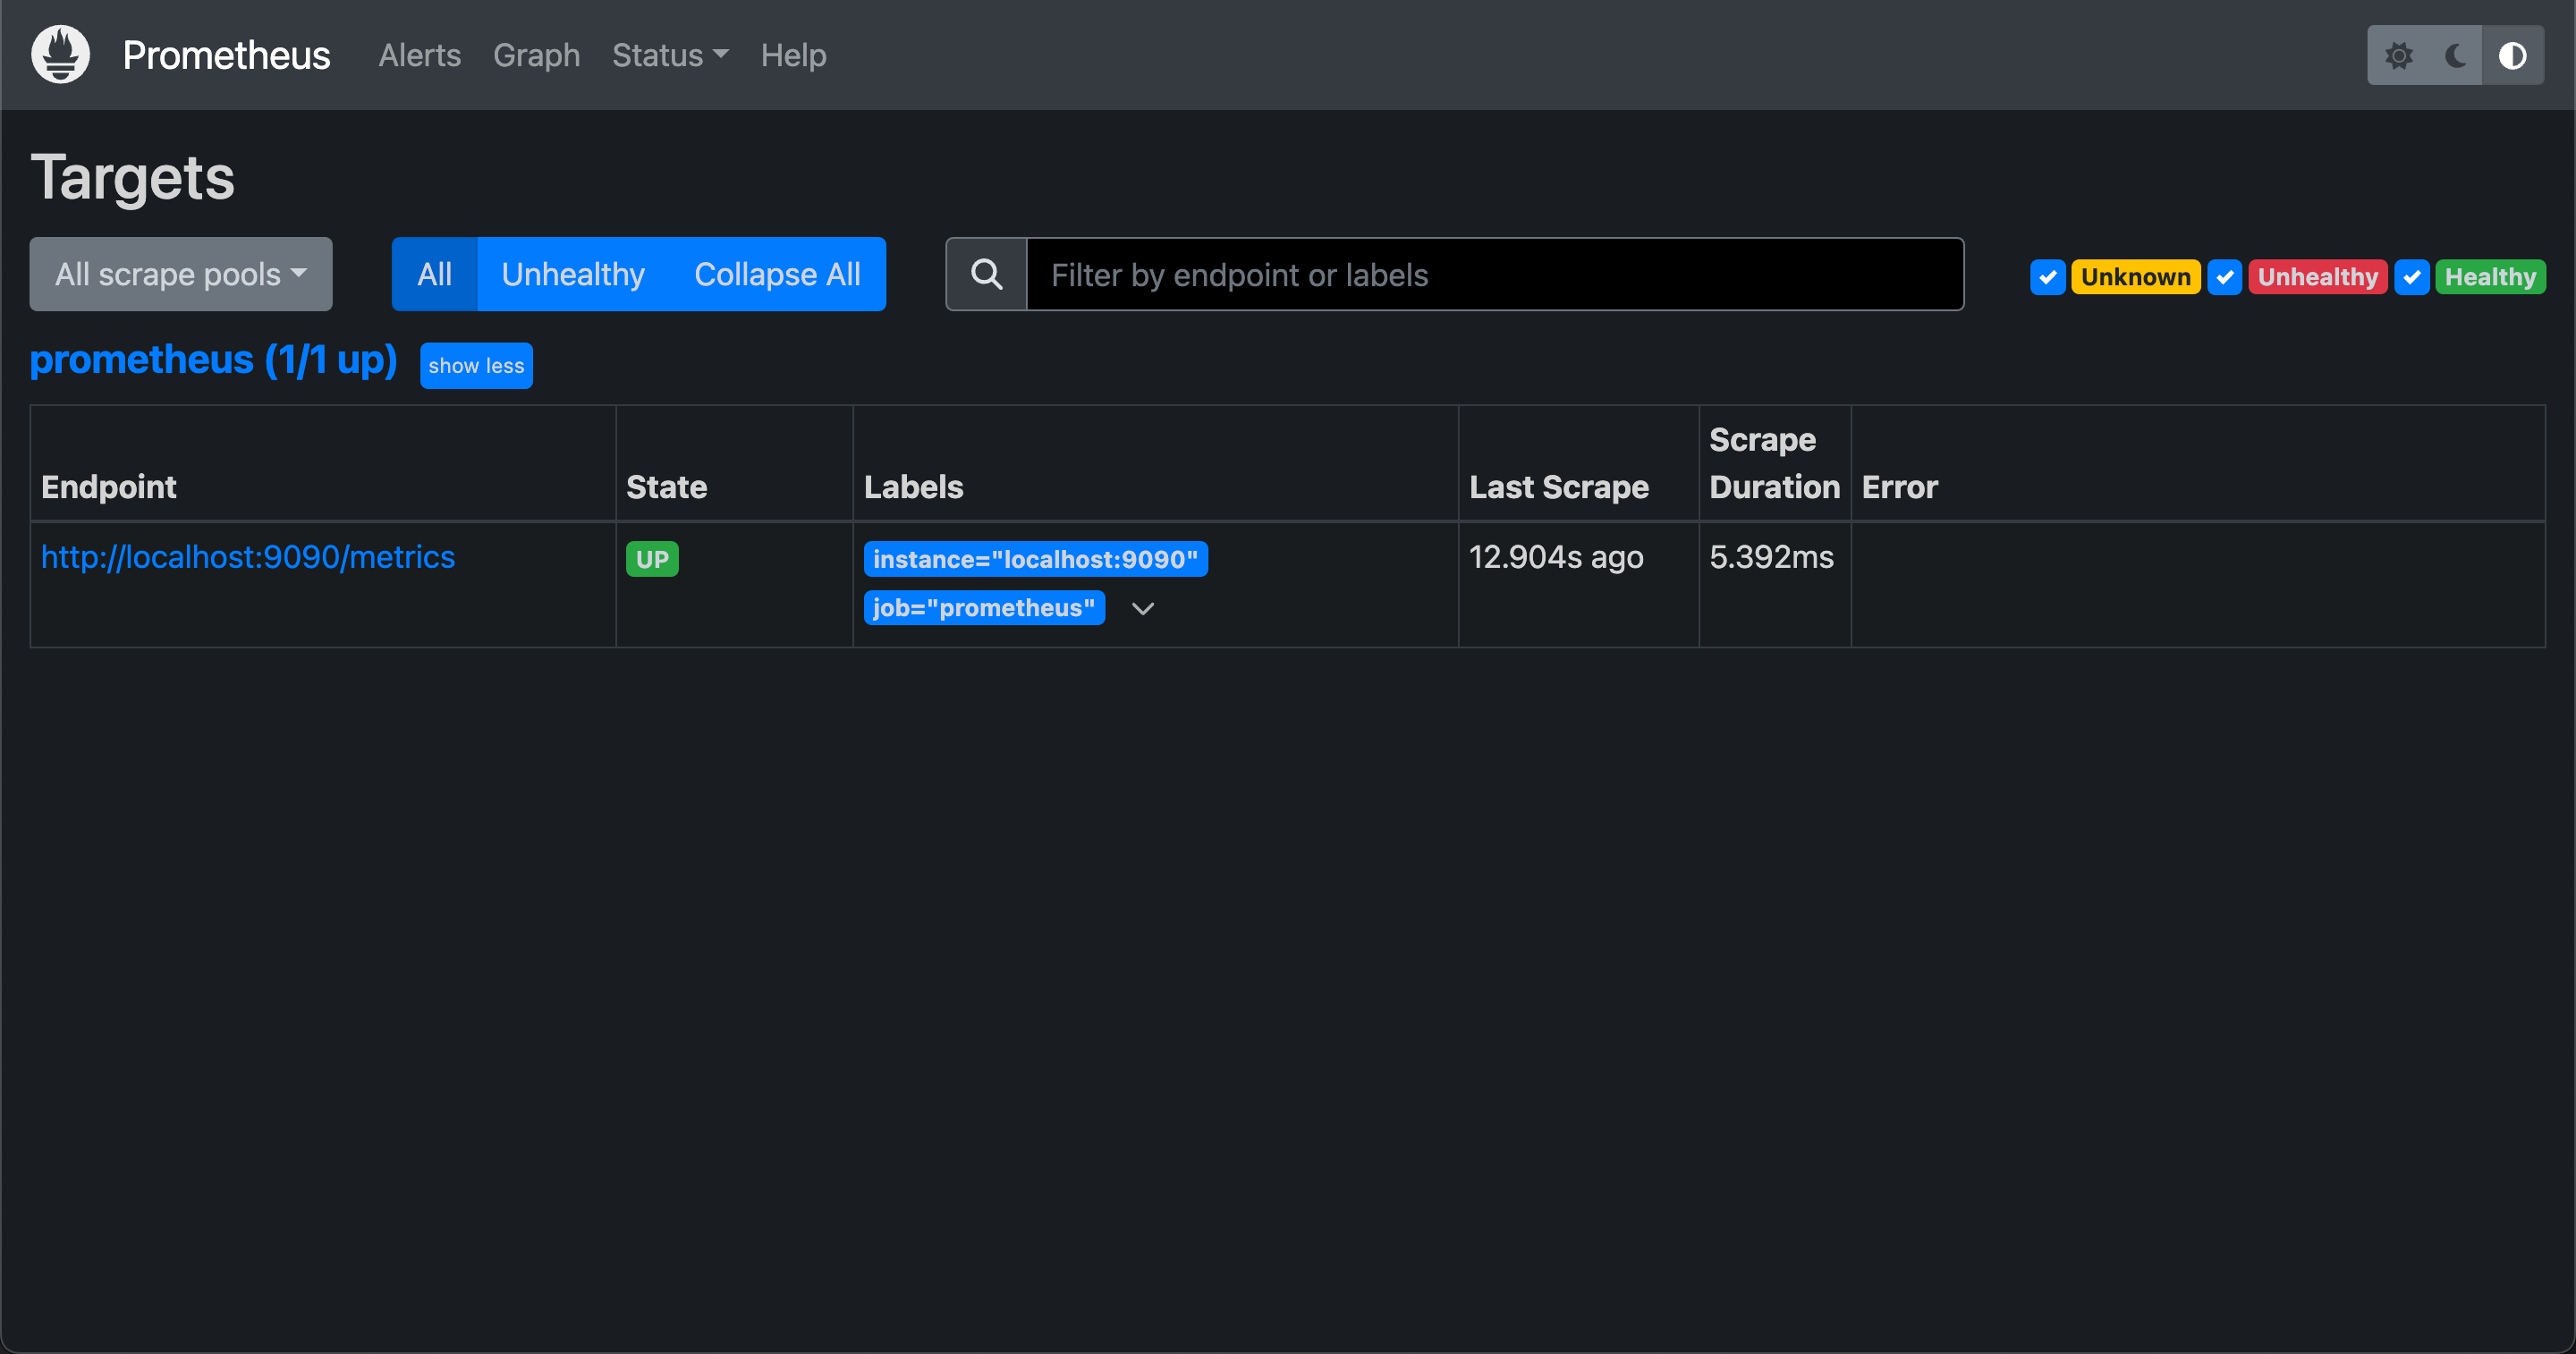
- prometheus.yml 수정
- properties에서 설정한 포트와 동일하게 설정한다.
scrape_configs:
  - job_name: "prometheus"
    static_configs:
    - targets: ["localhost:9090"]
  - job_name: "spring-actuator"
    metrics_path: "/actuator/prometheus"
    scrape_interval: 5s
    static_configs:
- targets: ["localhost:8090"]- brew services restart prometheus
- security 설정:
/actuator/prometheus에대한 접근 권한을 설정한다.
그라파나
- brew install grafana
- brew services start grafana
- http://localhost:3000/ 접속
- 초기 아이디, 비밀번호는 admin / admin 으로 로그인
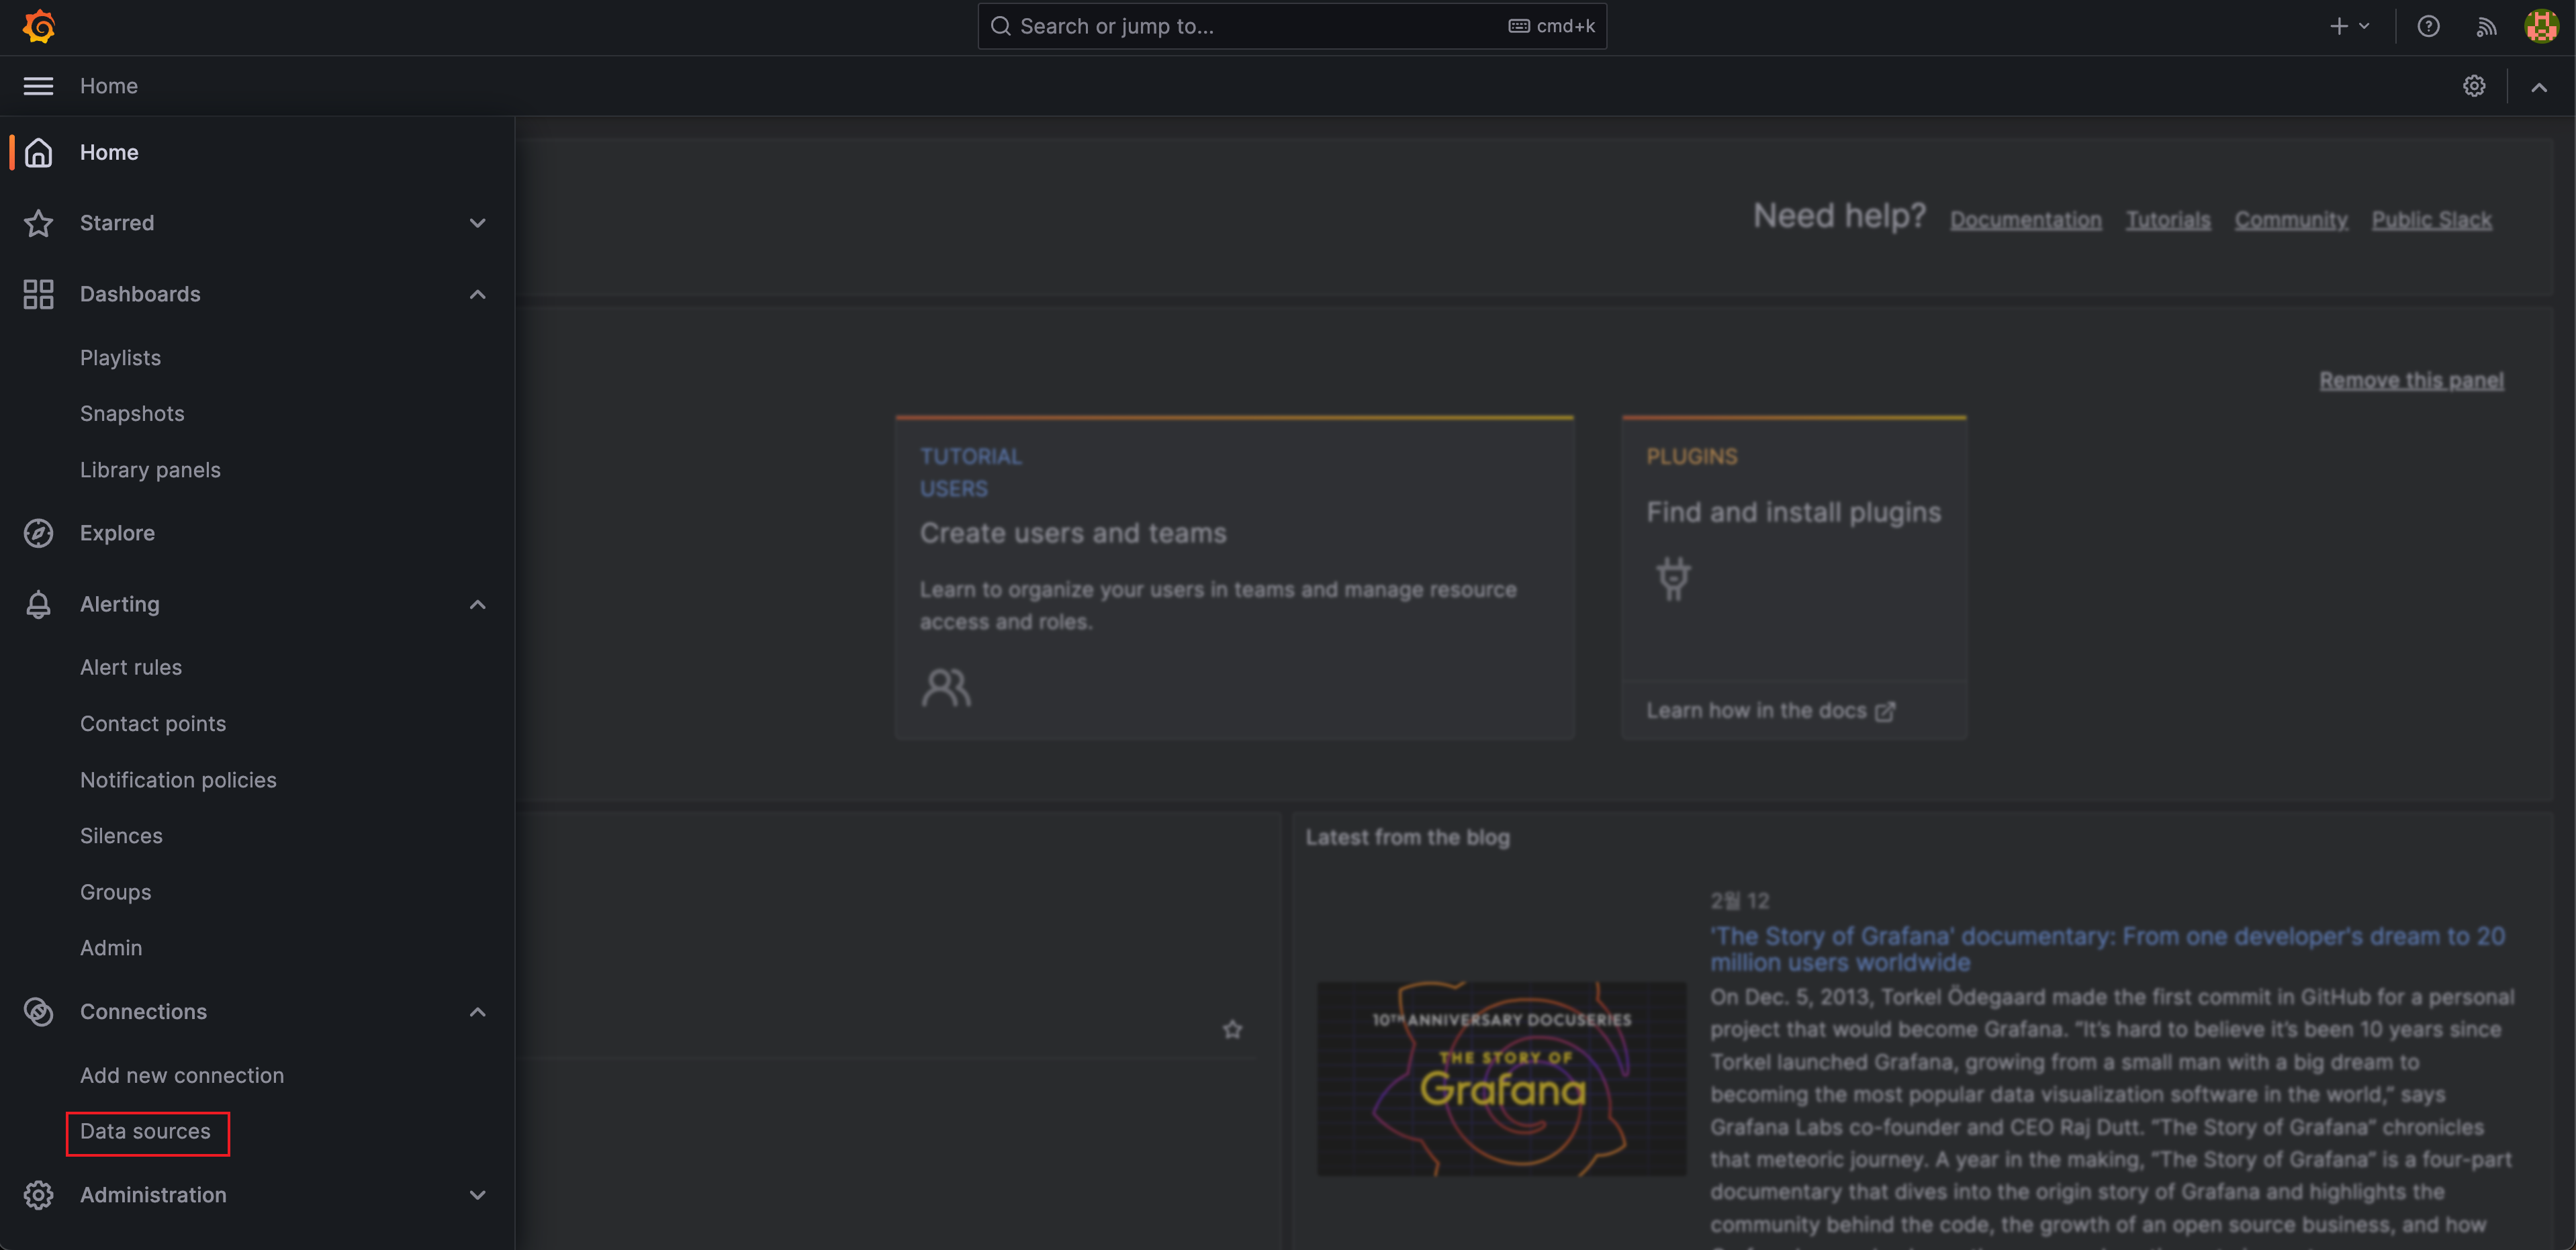
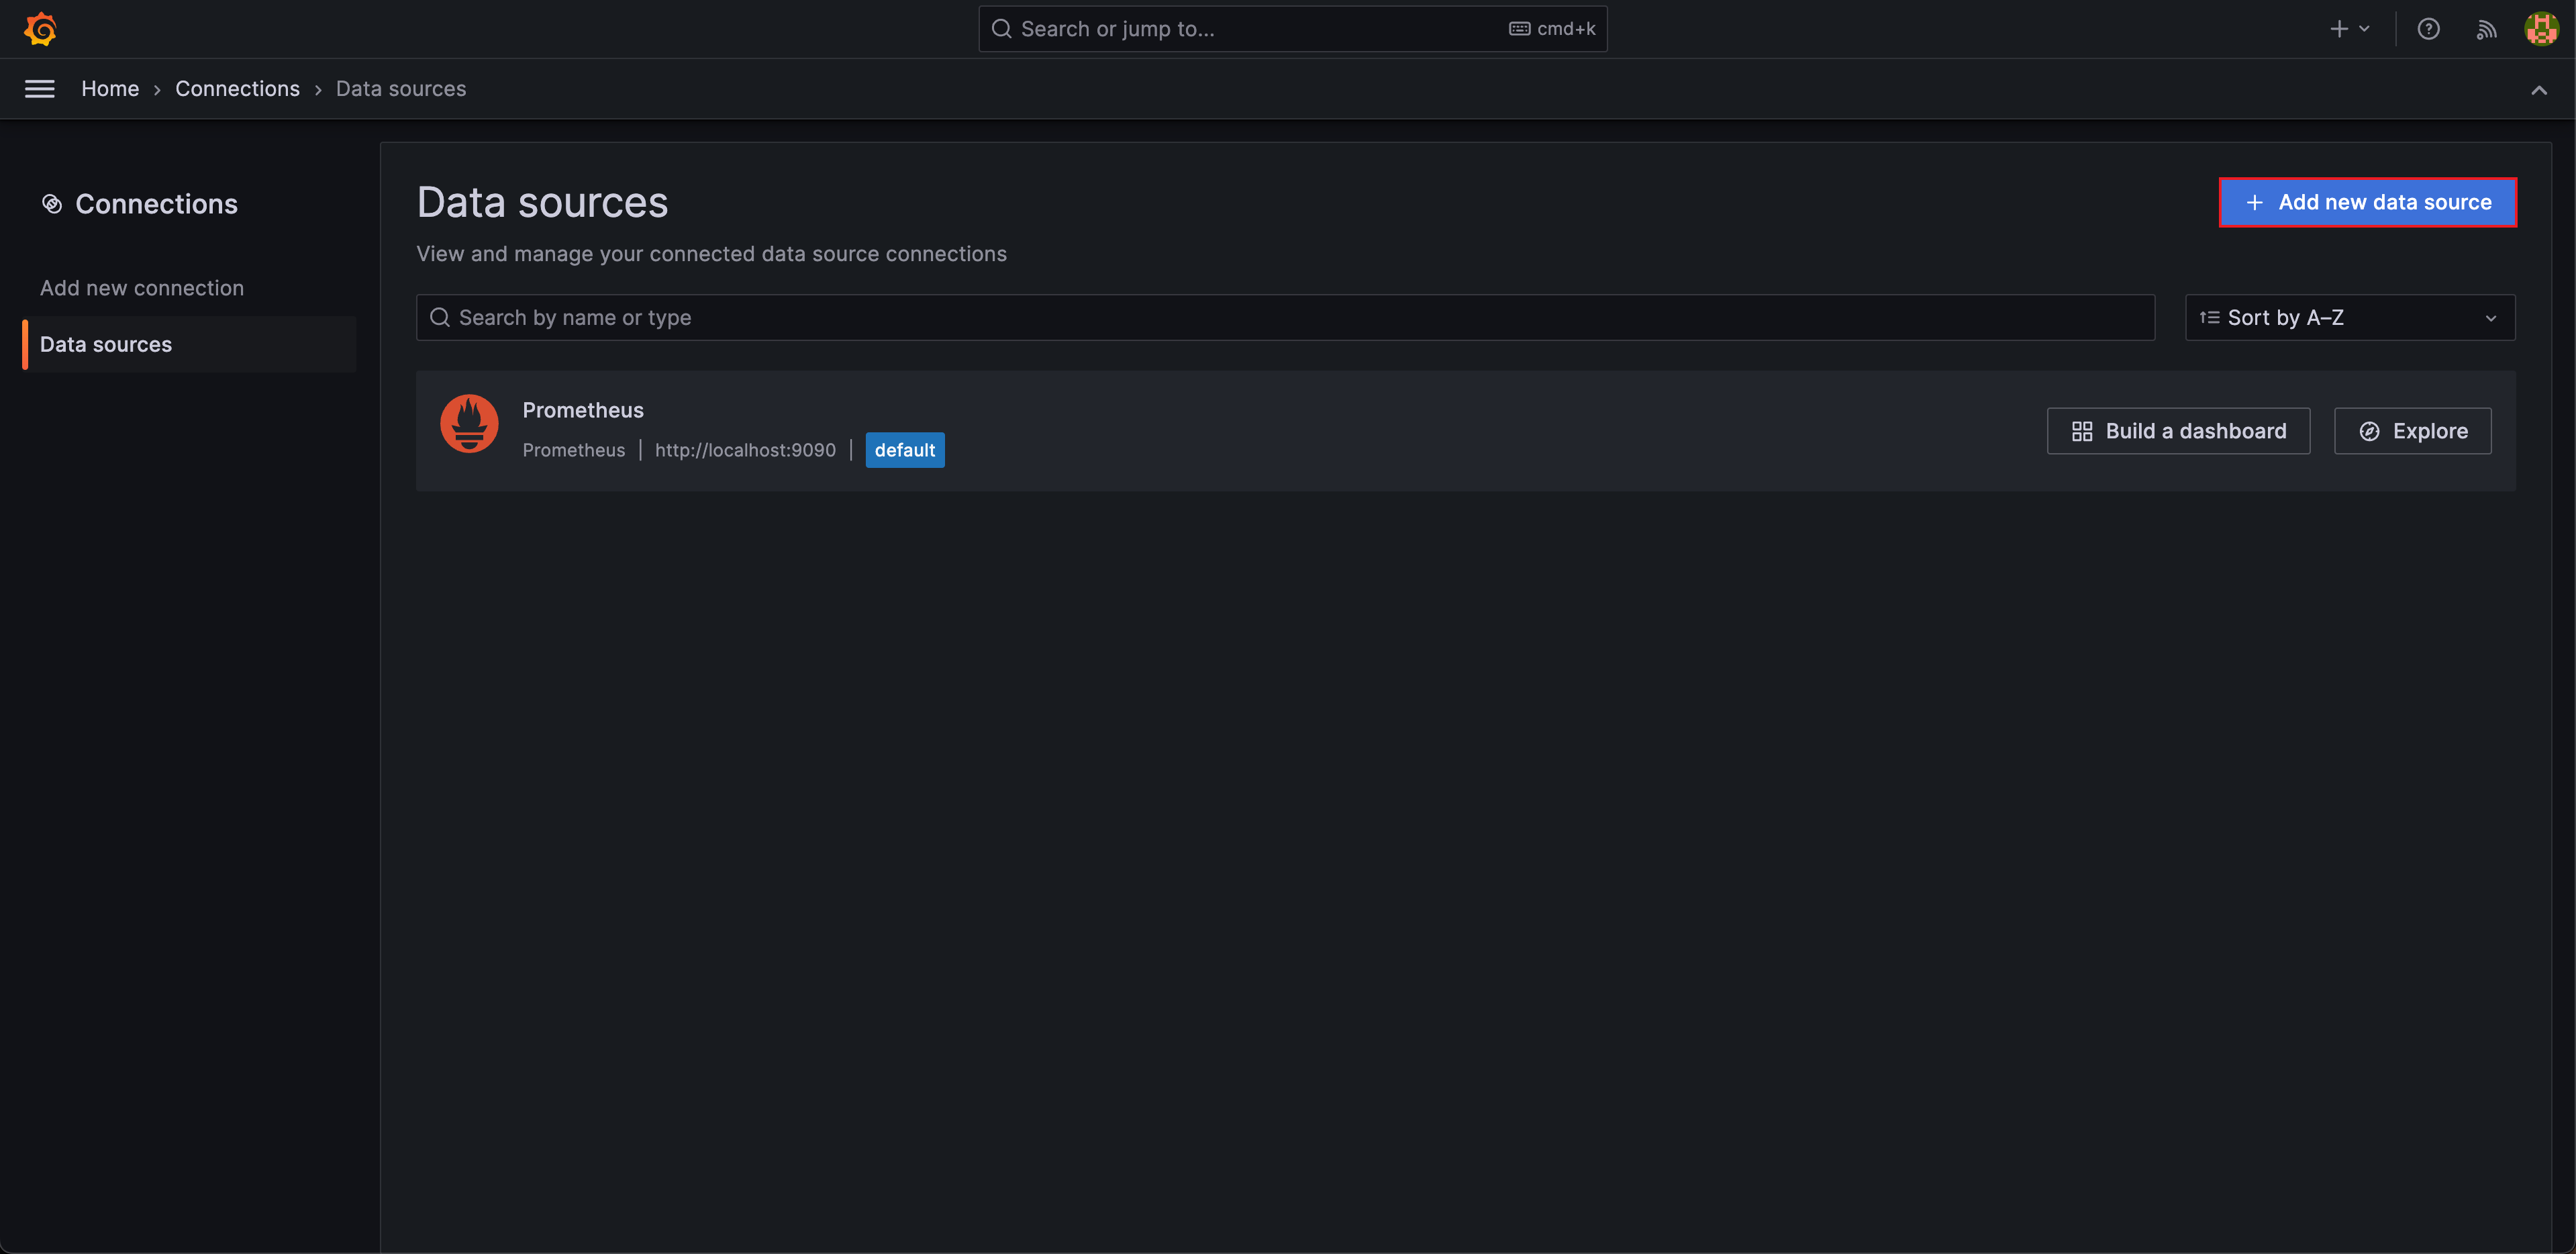
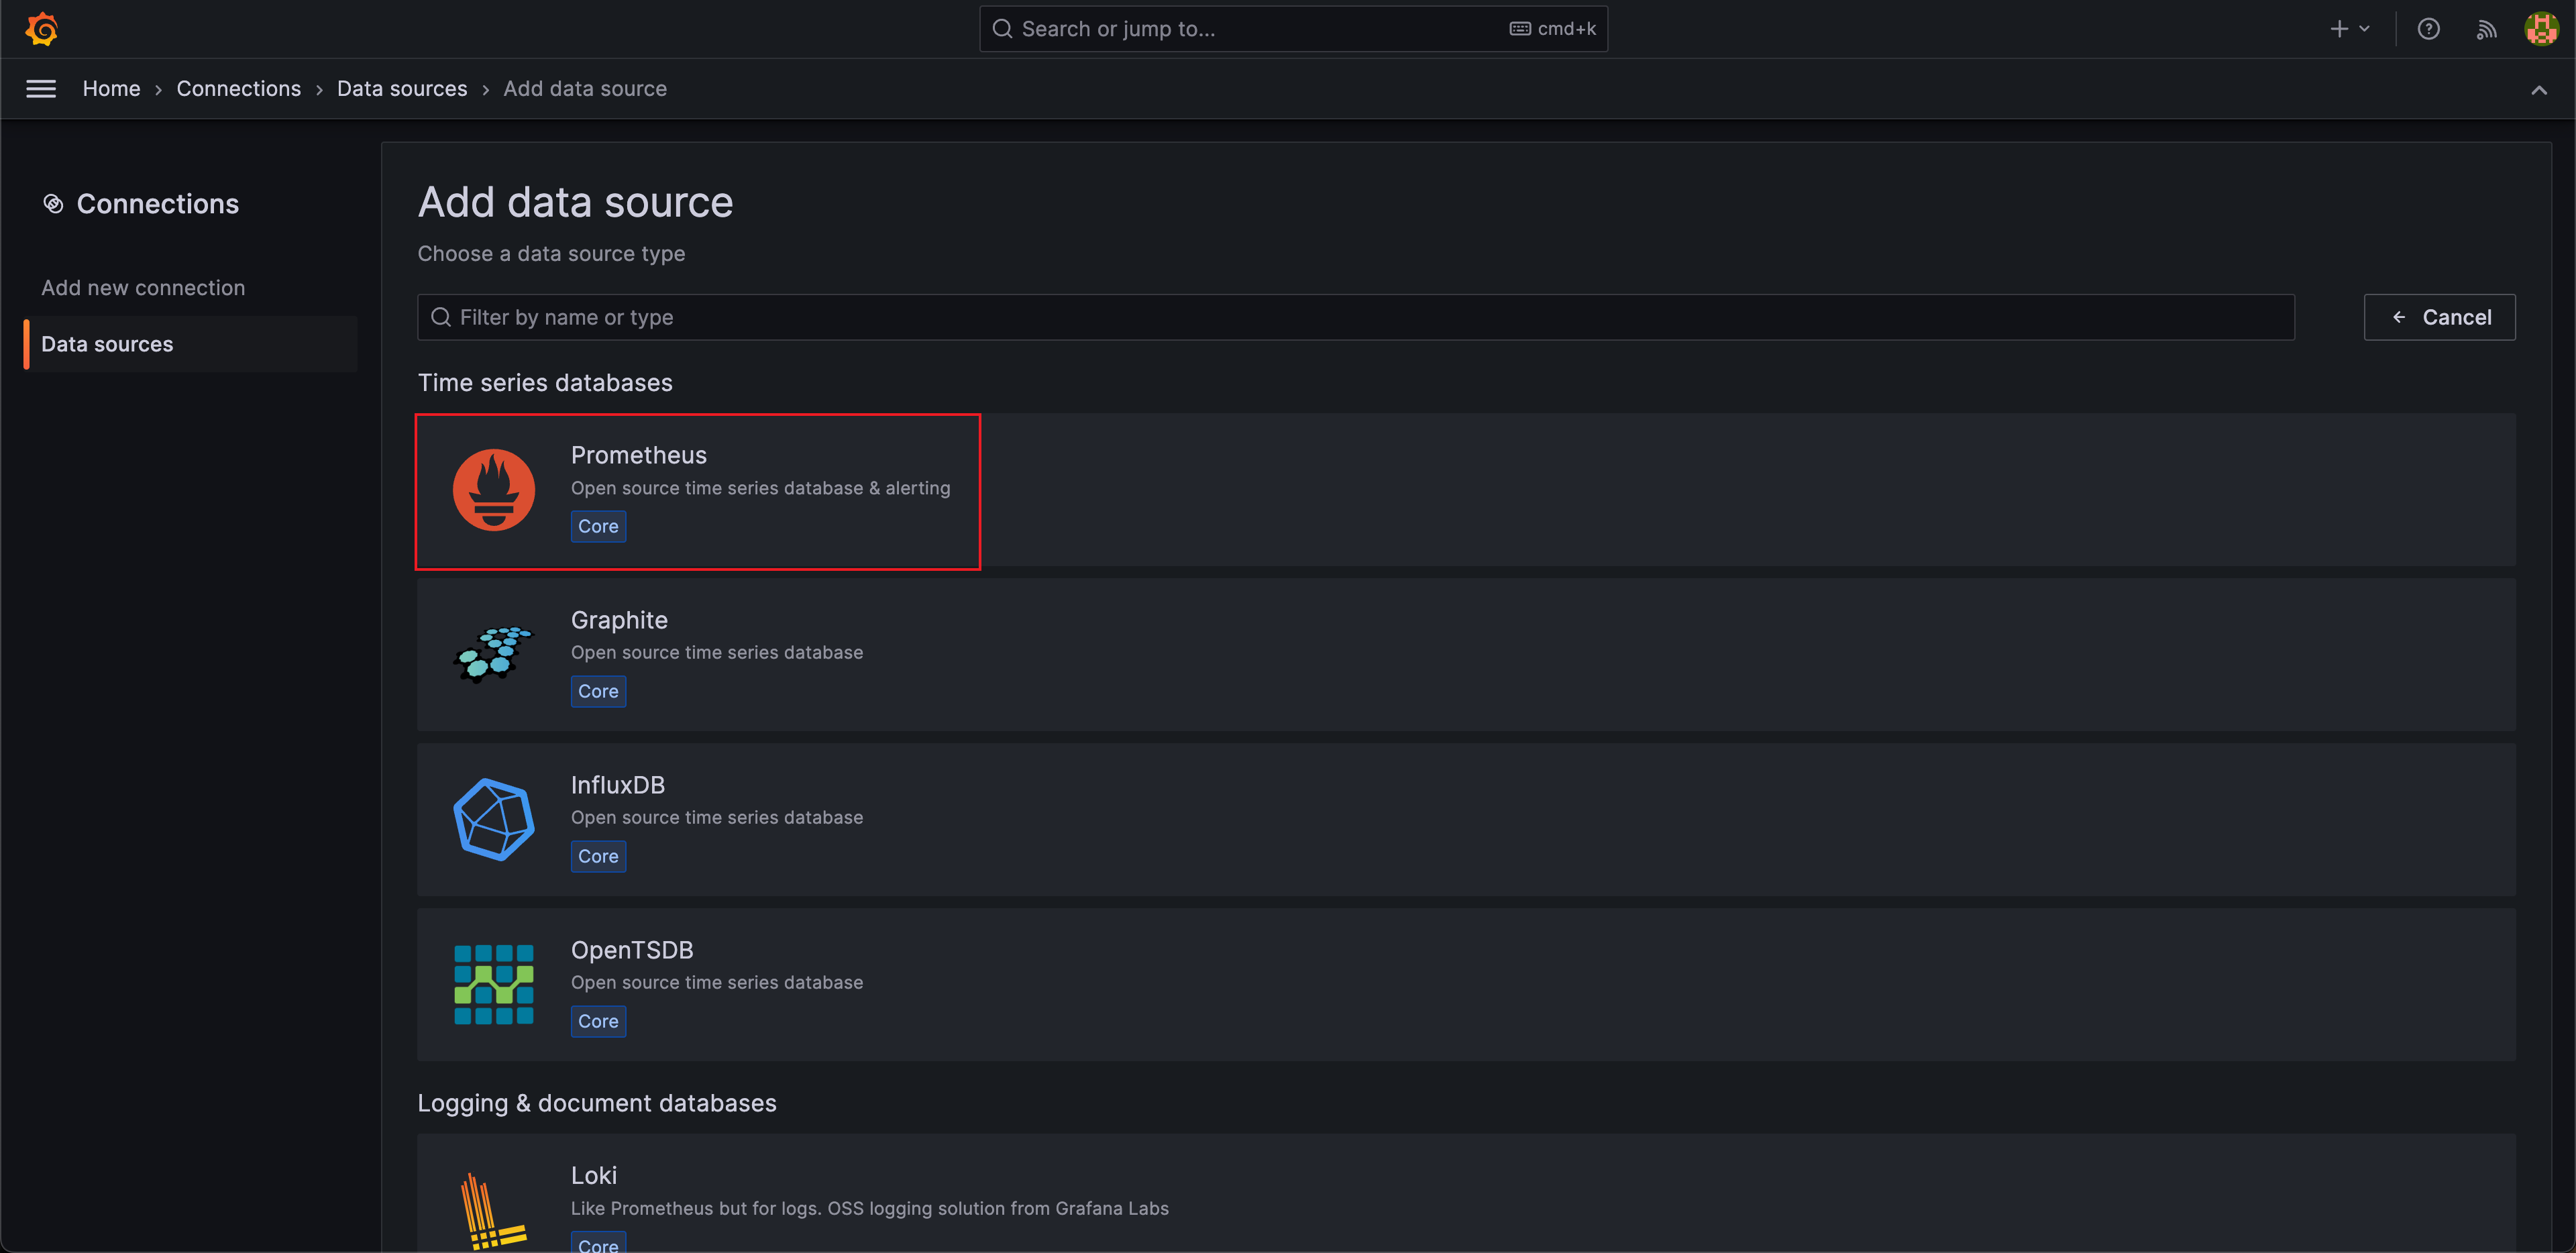
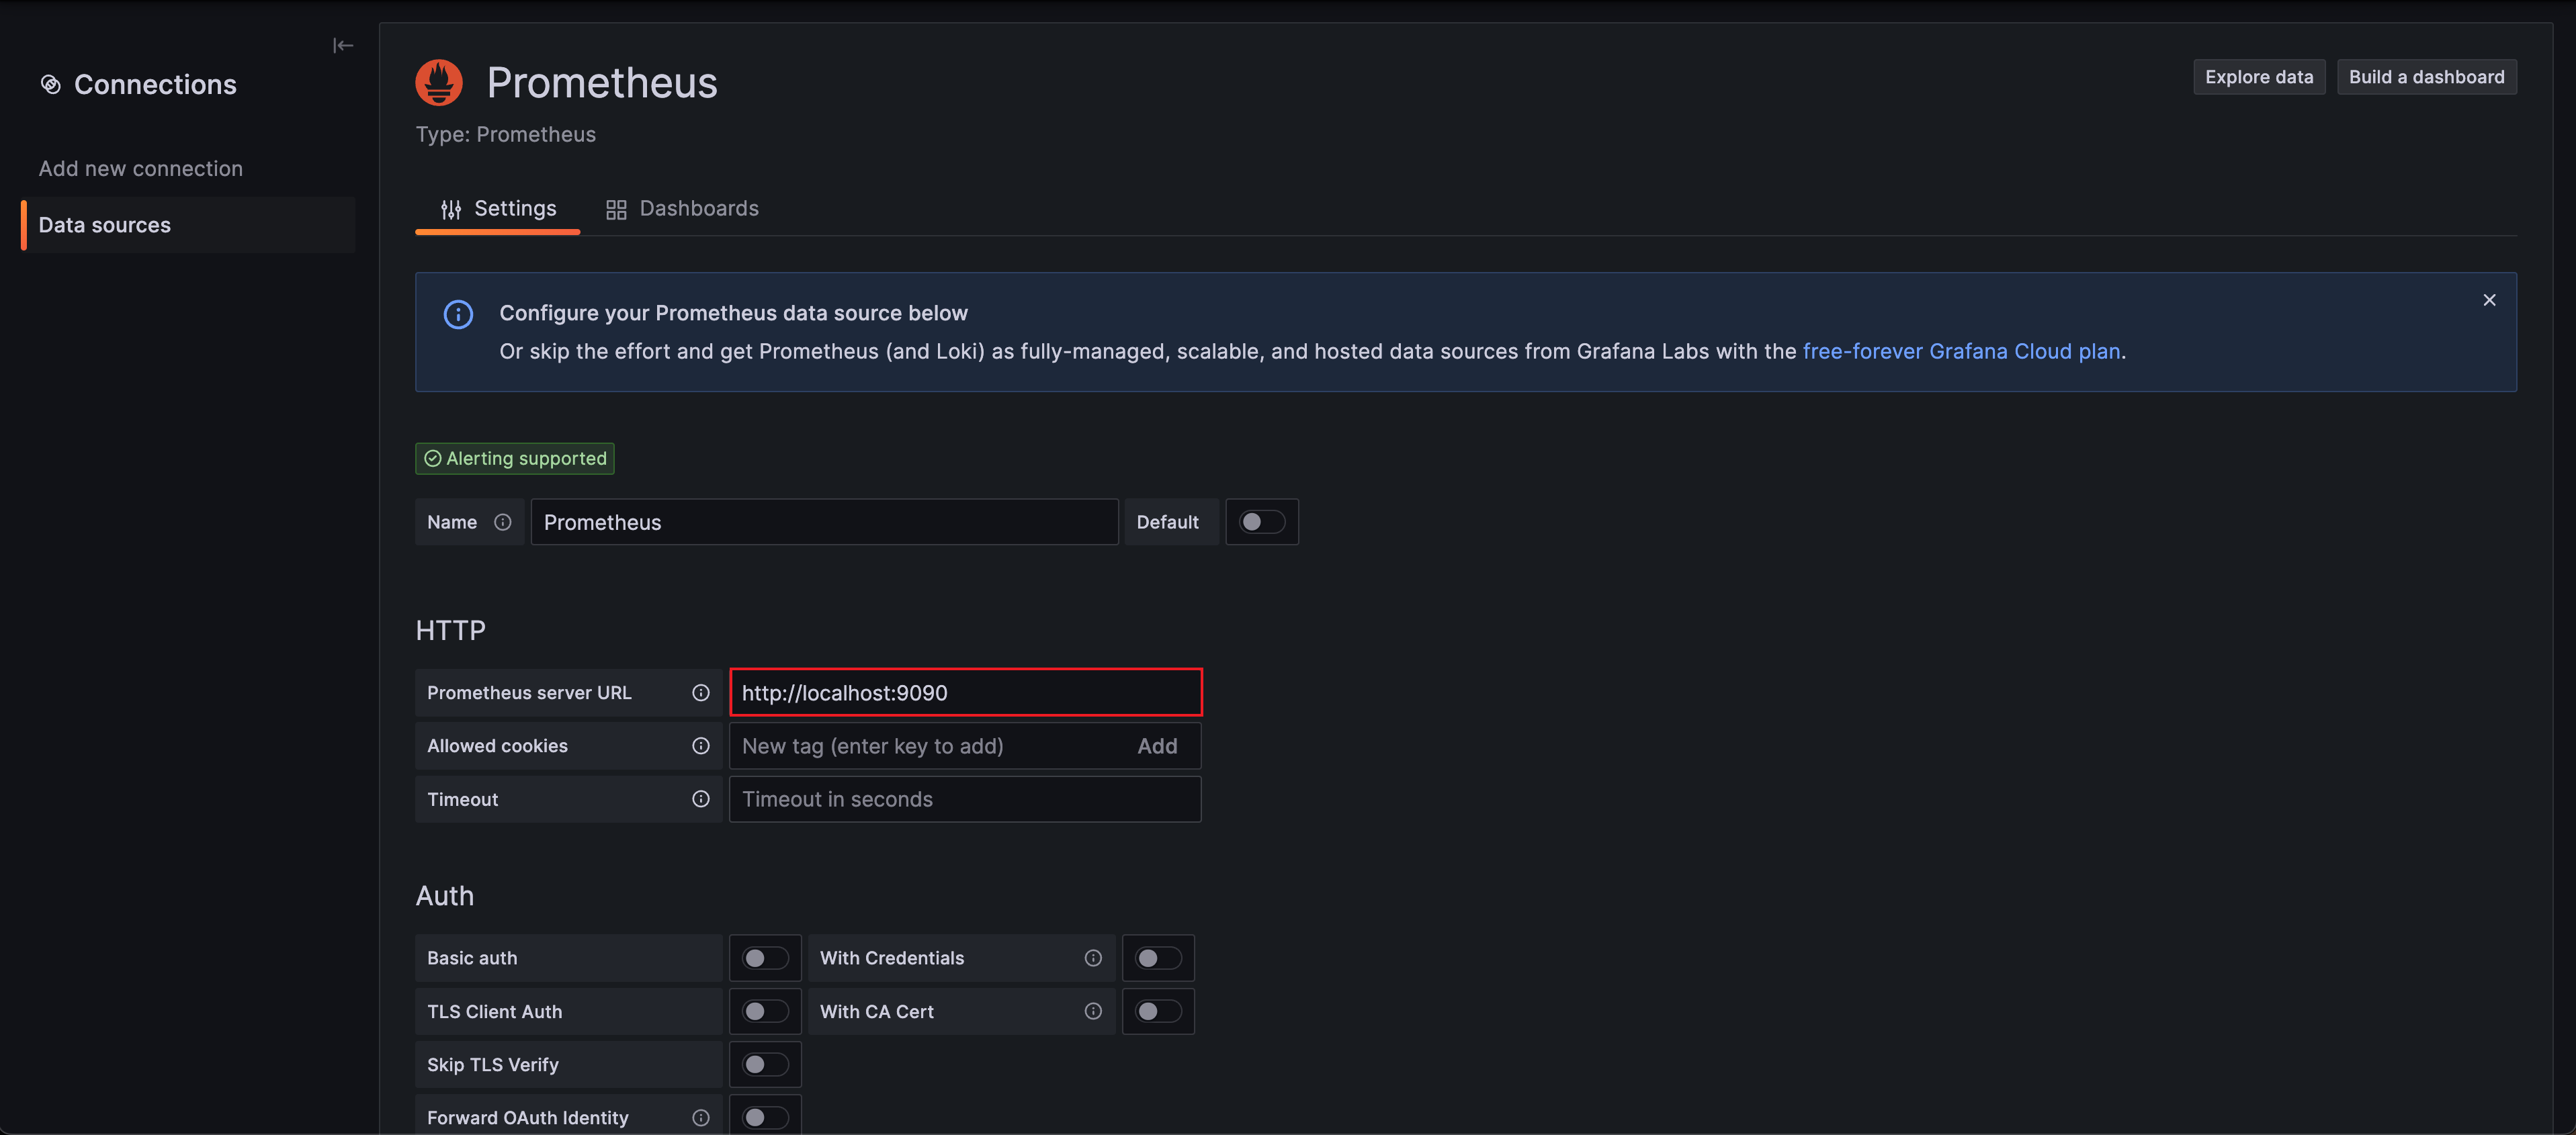
- 프로메테우스 추가
Prometheus server URL만 입력해주고 맨 아래의Save & Test버튼을 누른다.
Response Time Metric 추가
annotation을 붙인 메소드만 Response Time 정보를 수집할 것이기 때문에 annotation을 추가해준다.
@Target(ElementType.METHOD)
@Retention(RetentionPolicy.RUNTIME)
public @interface TimeTrace {}
annotation을 PointCut으로 지정하여 수행할 Aspect를 추가해준다.
@Slf4j
@Component
@Aspect
@RequiredArgsConstructor
public class TimeTraceAspect {
private final MeterRegistry meterRegistry;
@Pointcut("@annotation(joo.project.my3d.aop.TimeTrace)")
private void timeTracePointcut() {}
@Around("timeTracePointcut()")
public Object traceTime(ProceedingJoinPoint joinPoint) throws Throwable {
Timer timer = Timer
.builder("response_time_ms")
.register(meterRegistry);
StopWatch stopWatch = new StopWatch();
try {
stopWatch.start();
return joinPoint.proceed();
} finally {
stopWatch.stop();
timer.record(stopWatch.getTotalTimeMillis(), TimeUnit.MILLISECONDS);
log.debug(
"{} - Total time = {}s = {}ms",
joinPoint.getSignature().toShortString(),
stopWatch.getTotalTimeSeconds(),
stopWatch.getTotalTimeMillis());
}
}
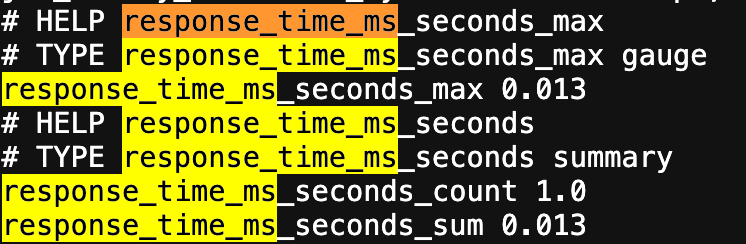
}이제 다시 /actuator/prometheus로 이동하여 response_time_ms라는 이름의 metric이 추가되었는지 확인한다.
아래처럼 log를 같이 확인해보니 정상적으로 값이 기록된 것을 알 수 있다.
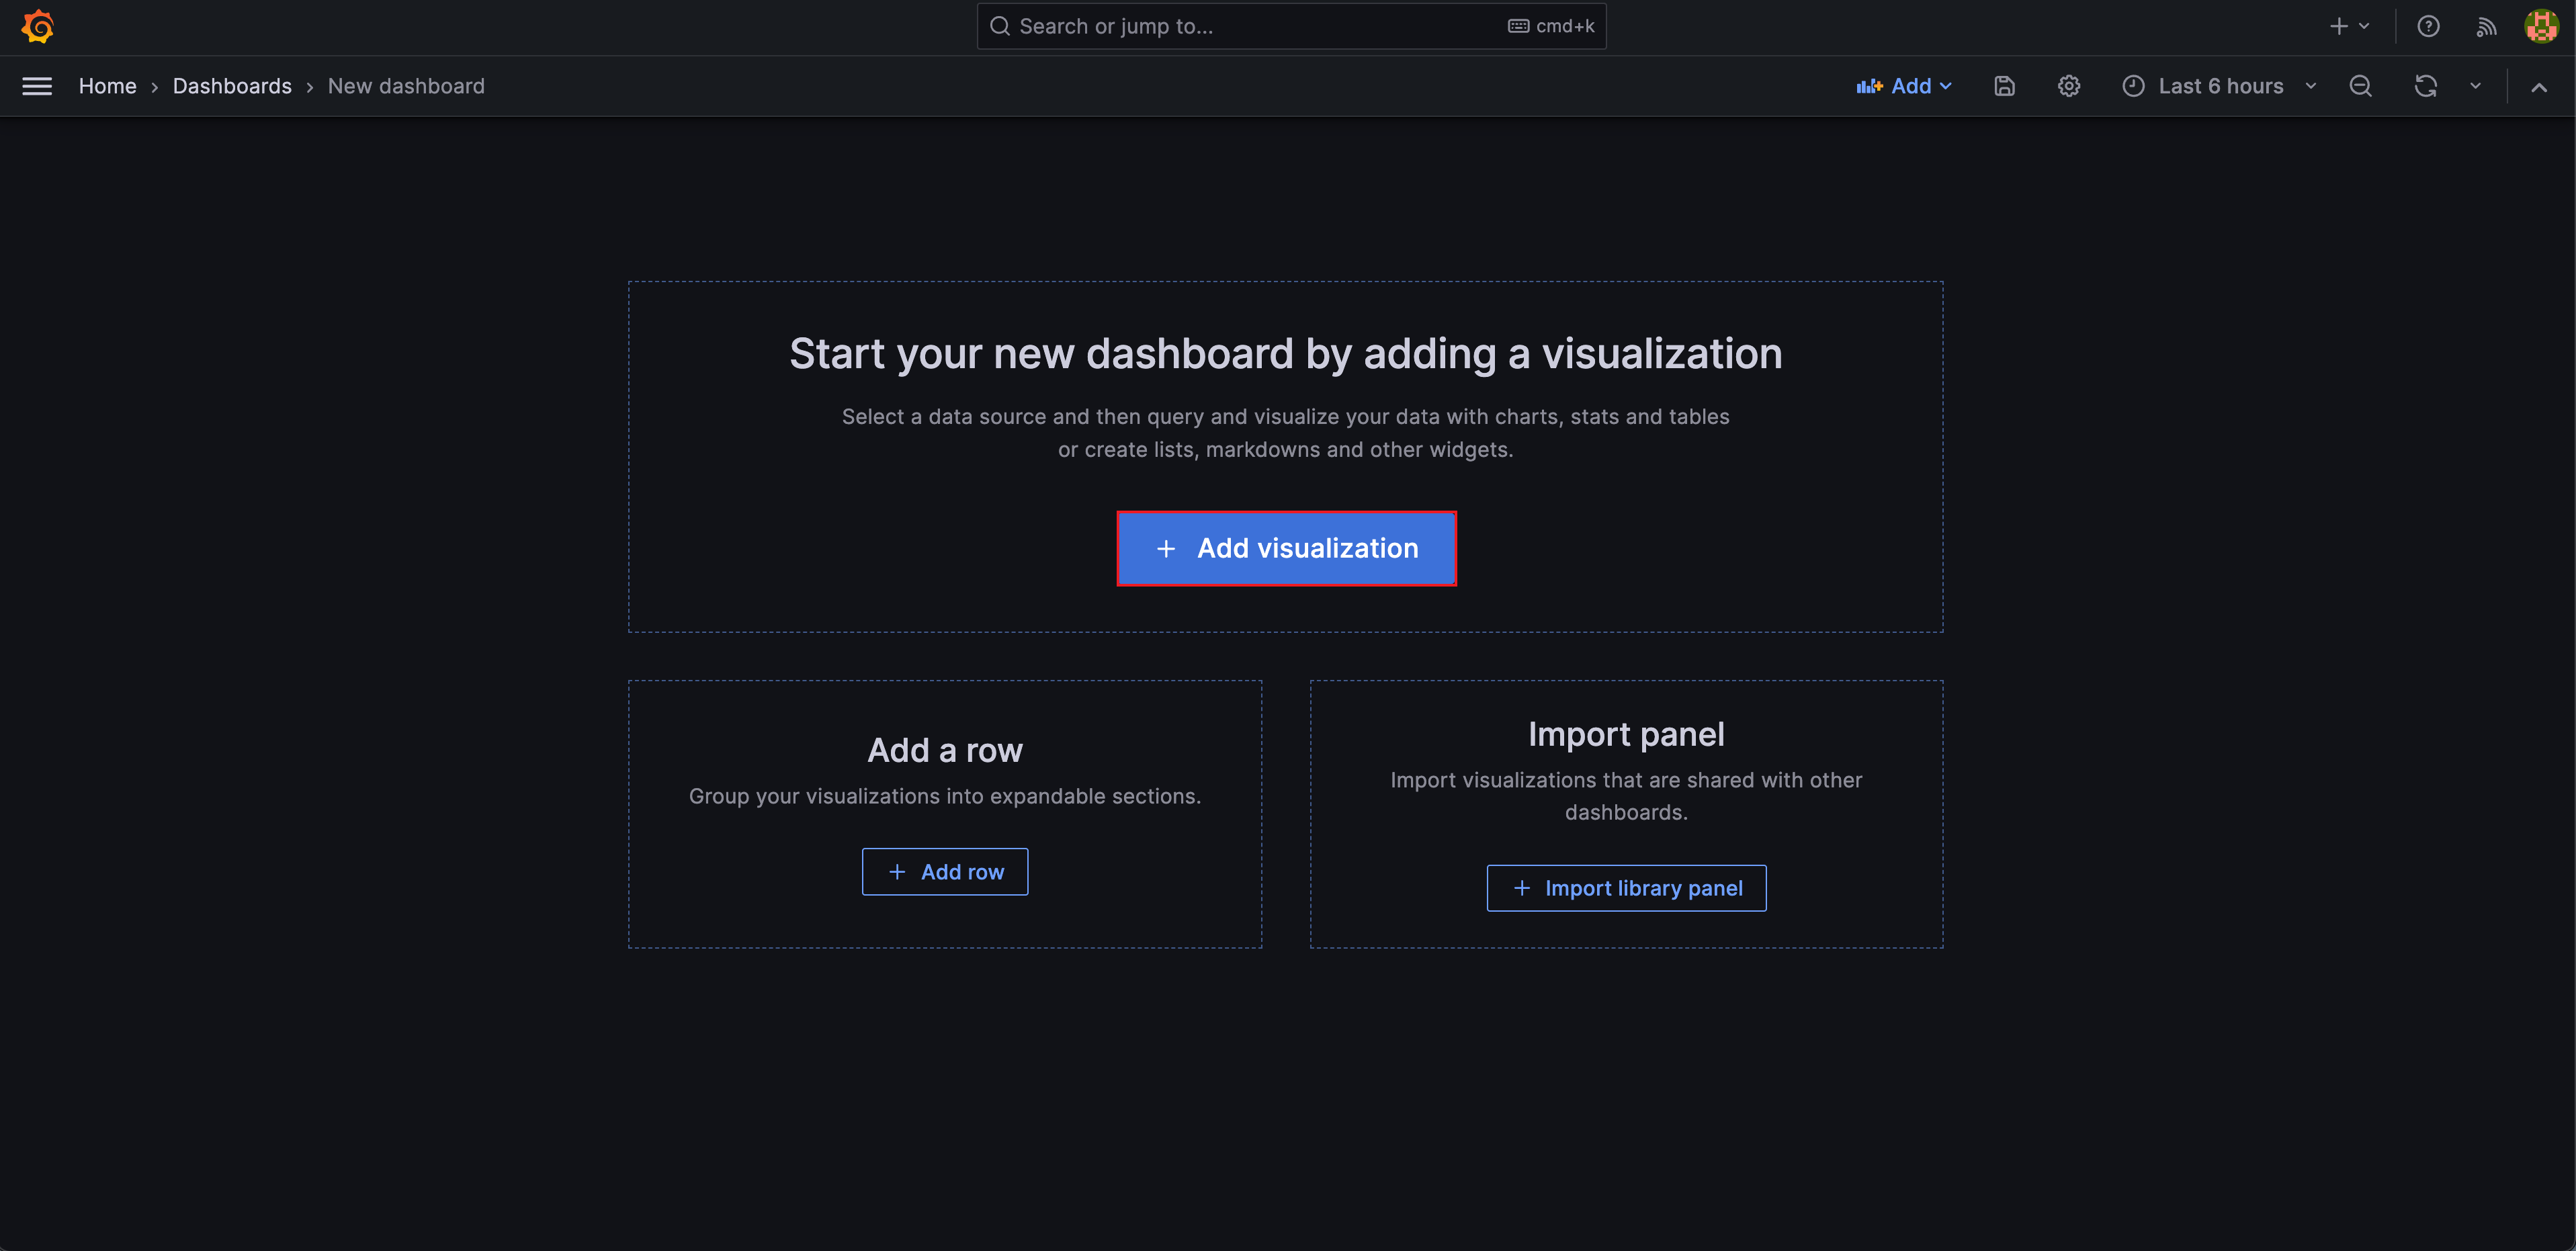
2024-02-14 15:39:35.662 DEBUG 5691 --- [nio-8080-exec-3] joo.project.my3d.aop.TimeTraceAspect : ArticlesController.articleBoard(..) - Total time = 0.013249417s = 13ms그라파나 대시보드 추가
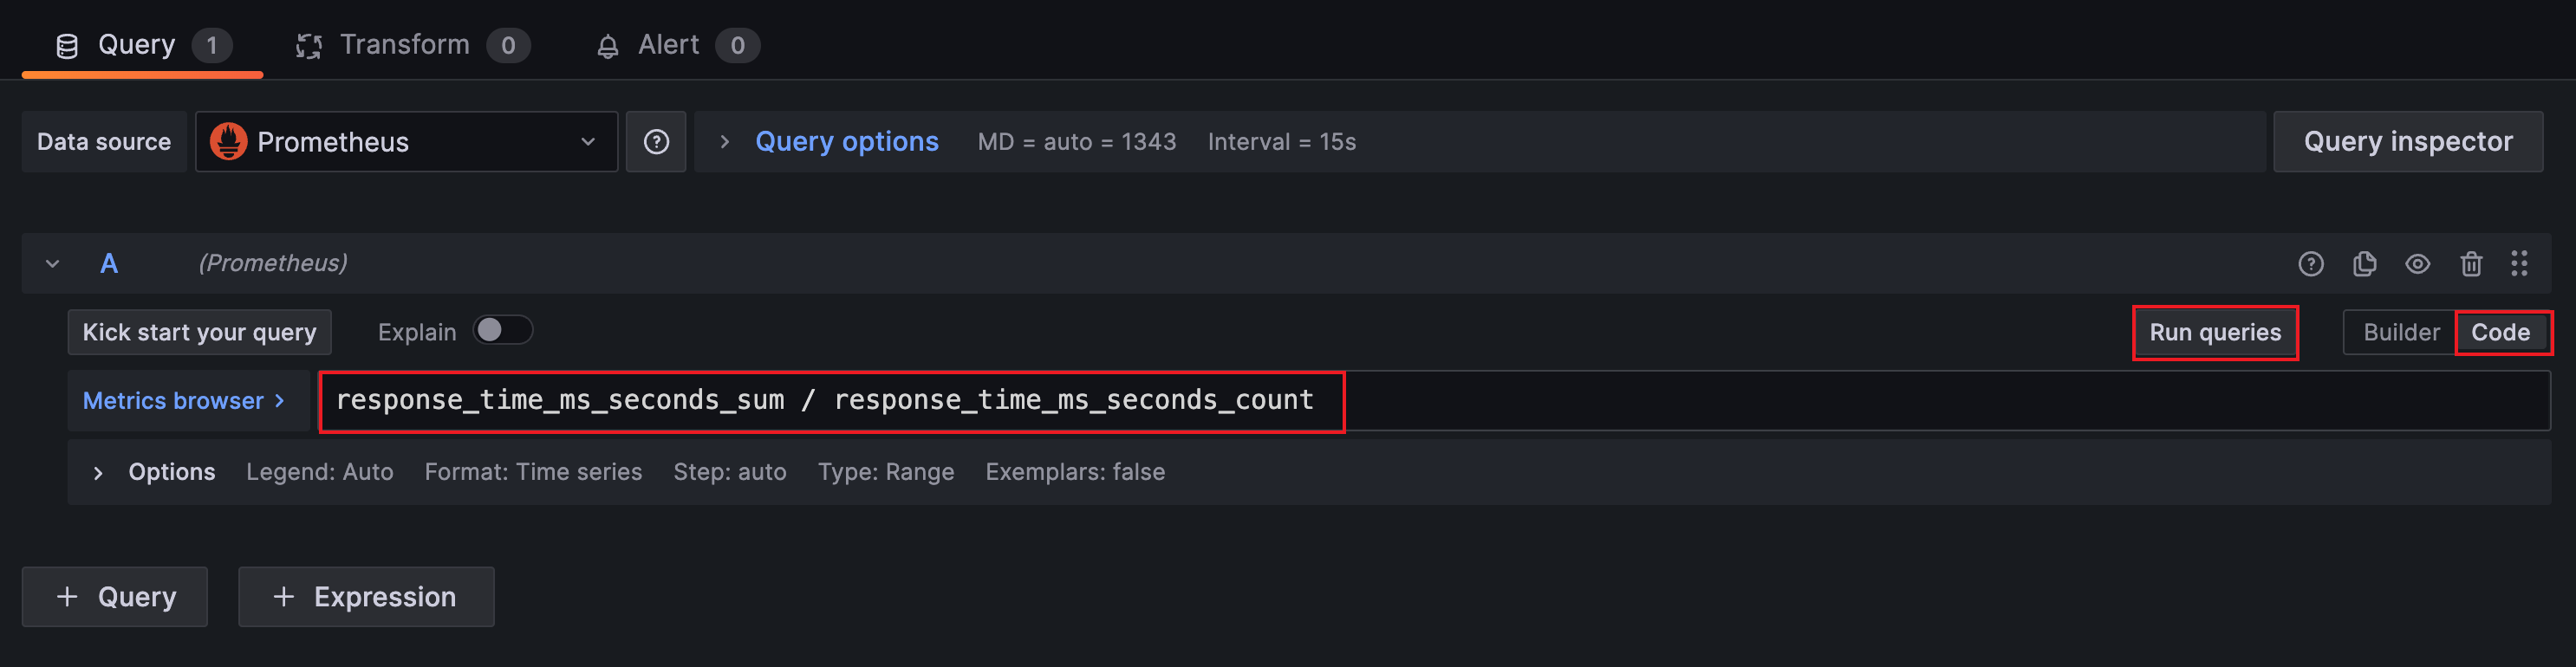
그라파나를 통해서 시각화하고 싶은 것은 response_time_ms_seconds_count와 response_time_ms_seconds_sum, 그리고 average response time이다. average response time은 response_time_ms_seconds_sum / response_time_ms_seconds_count으로 계산할 수 있다.
1. Response Time Sum
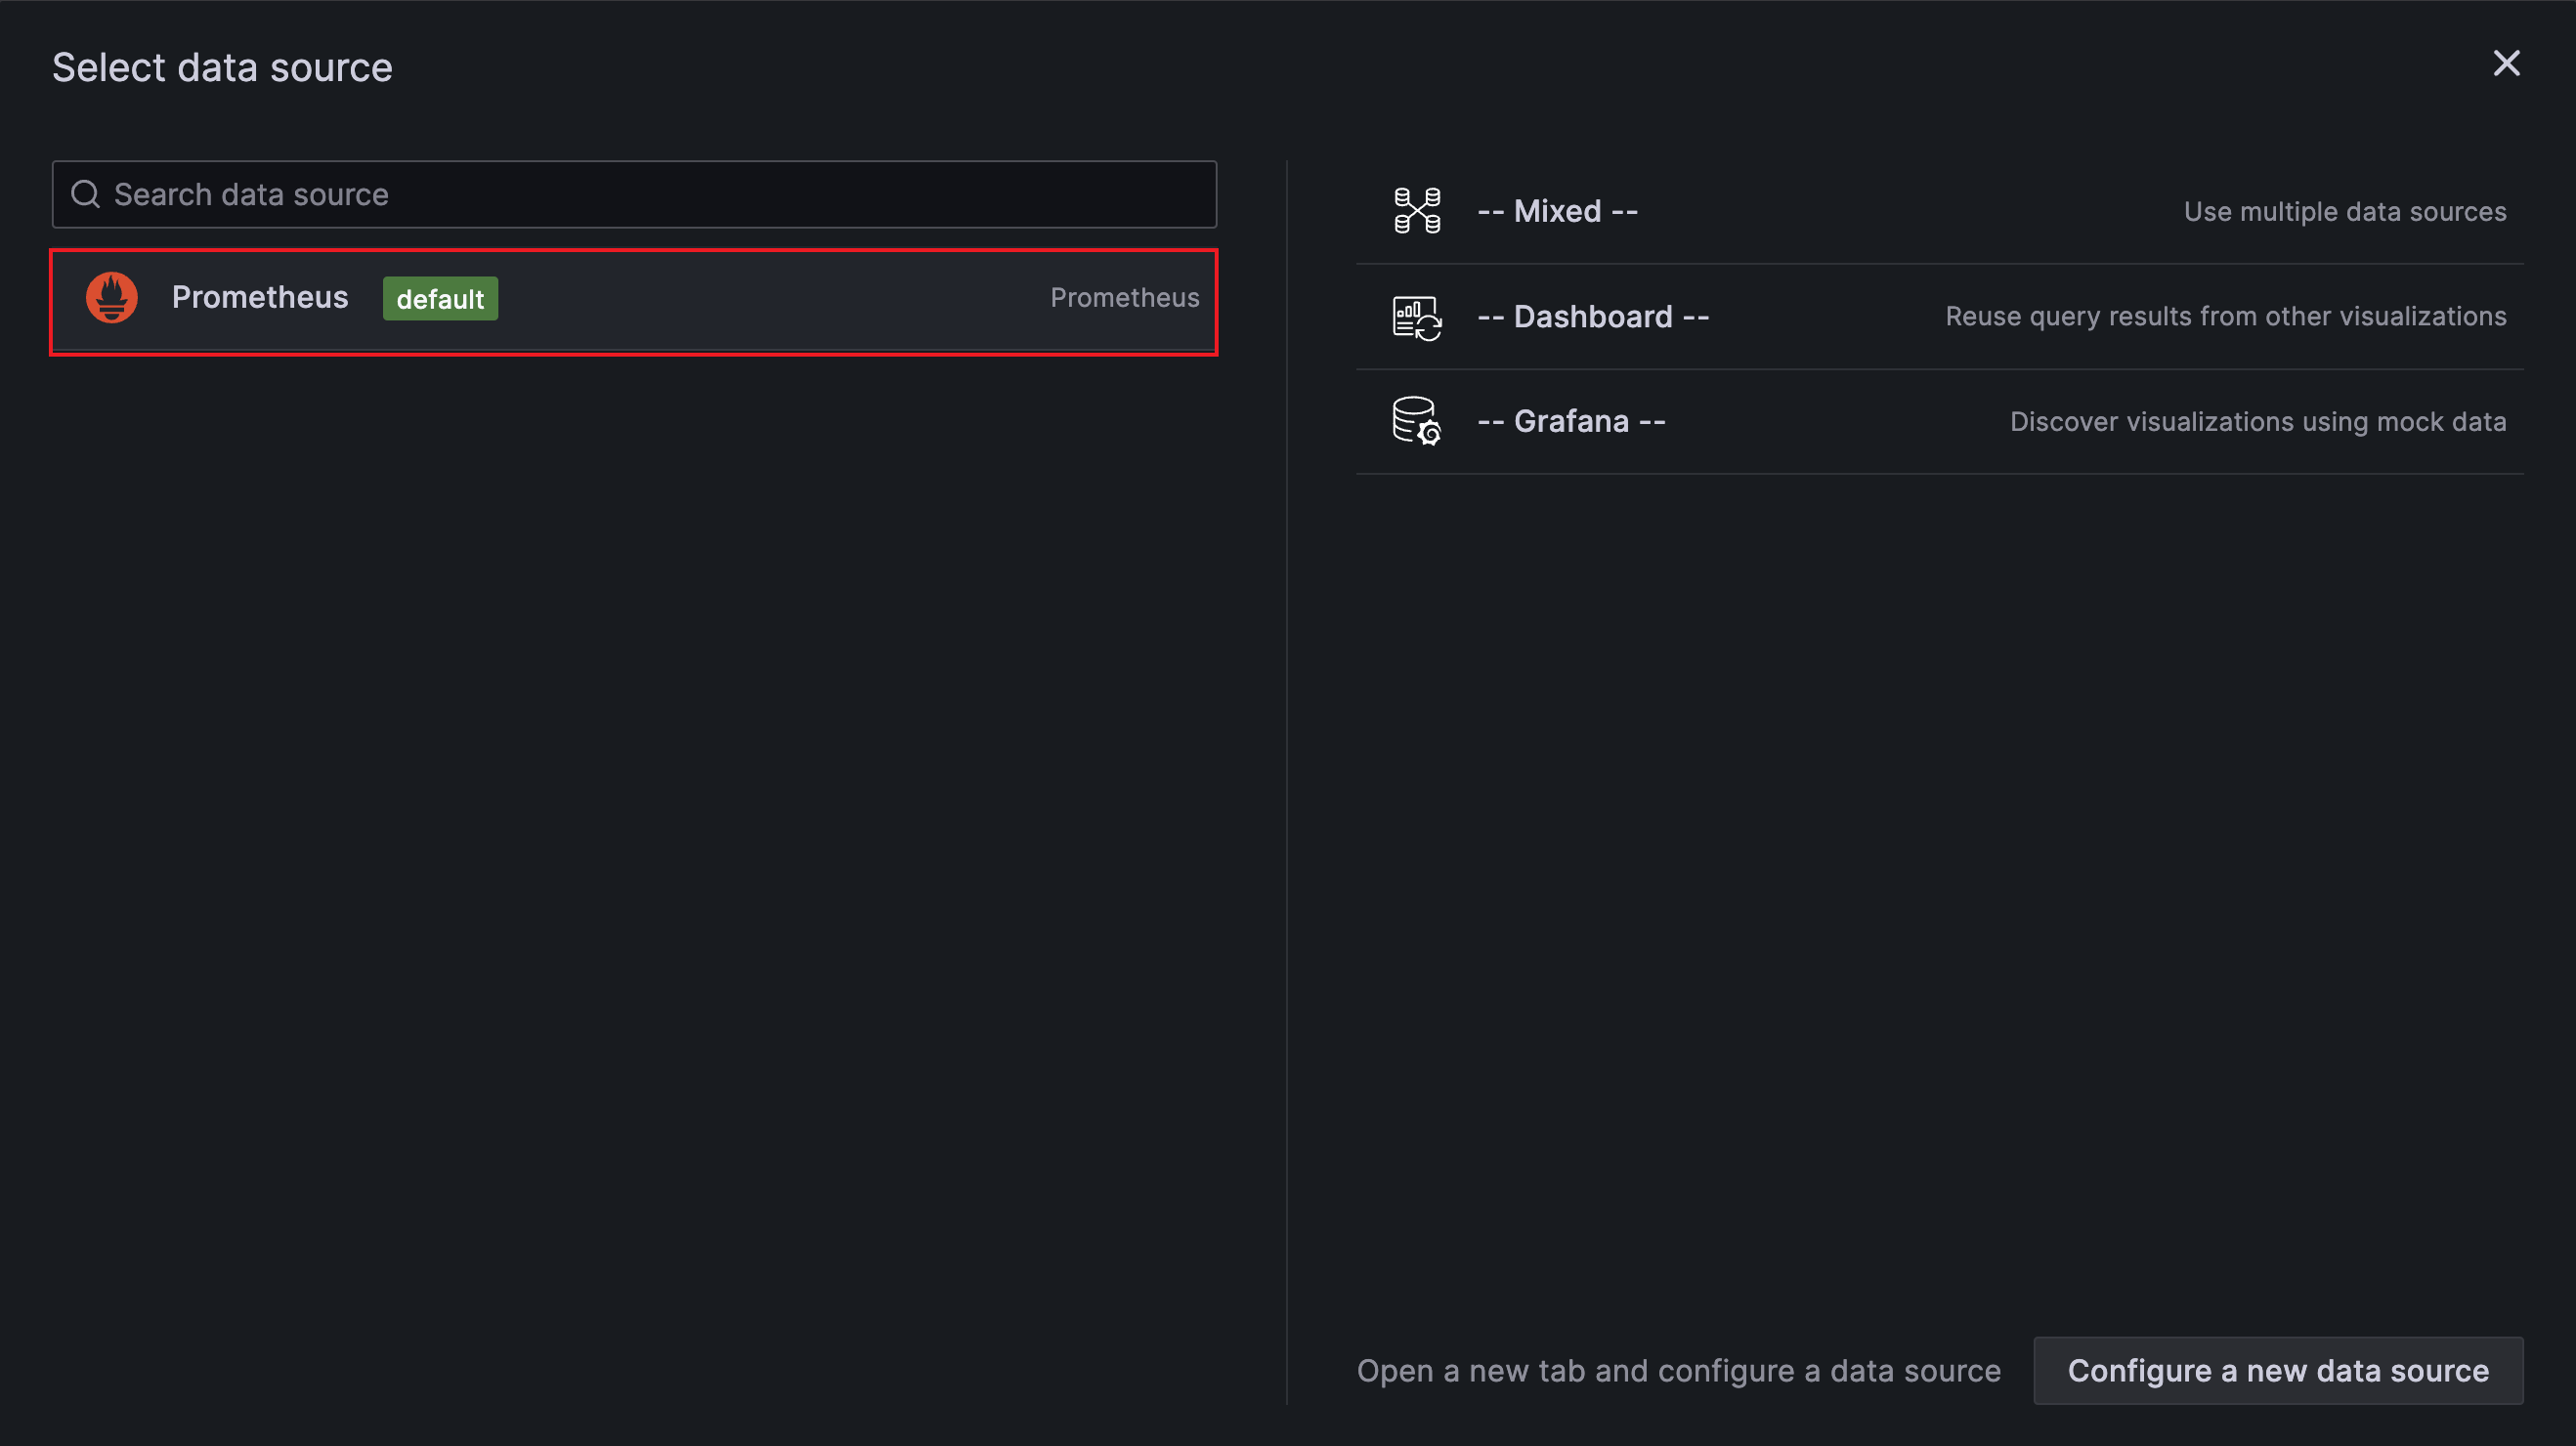
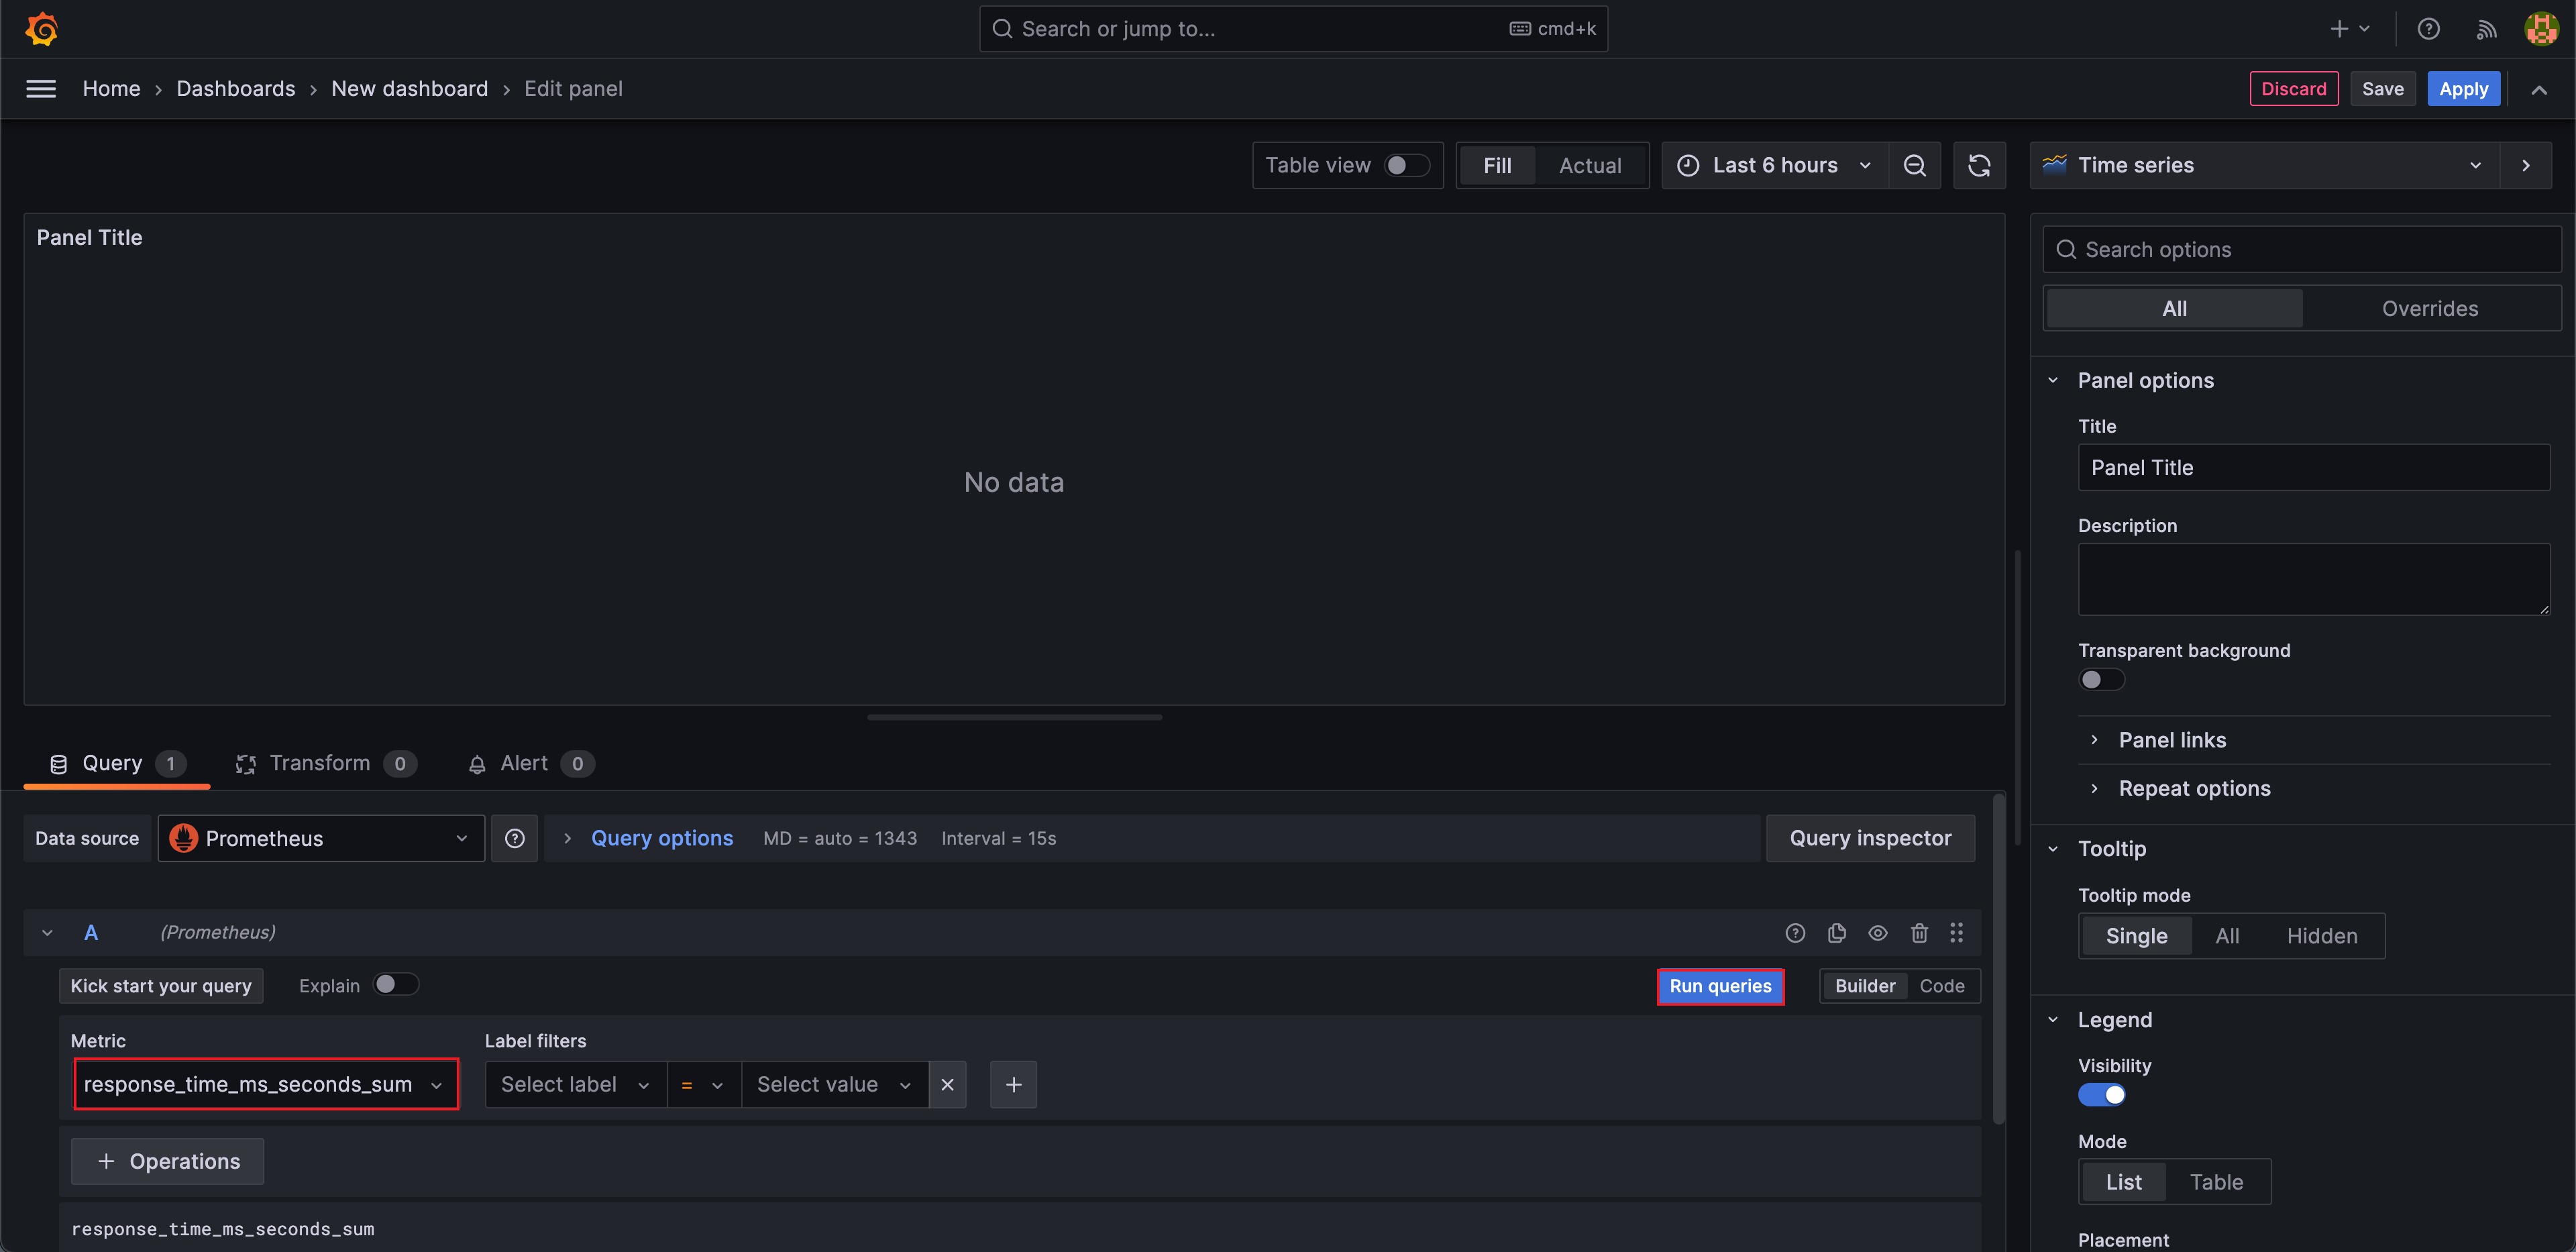
위처럼 Metric을 선택하고 Run queries를 눌러주면 기본으로 설정된 Time series 그래프가 생성된다. 하지만 Time series 그래프로 값을 확인하기 불편하기 때문에 Gauge 그래프로 설정해주도록 한다.
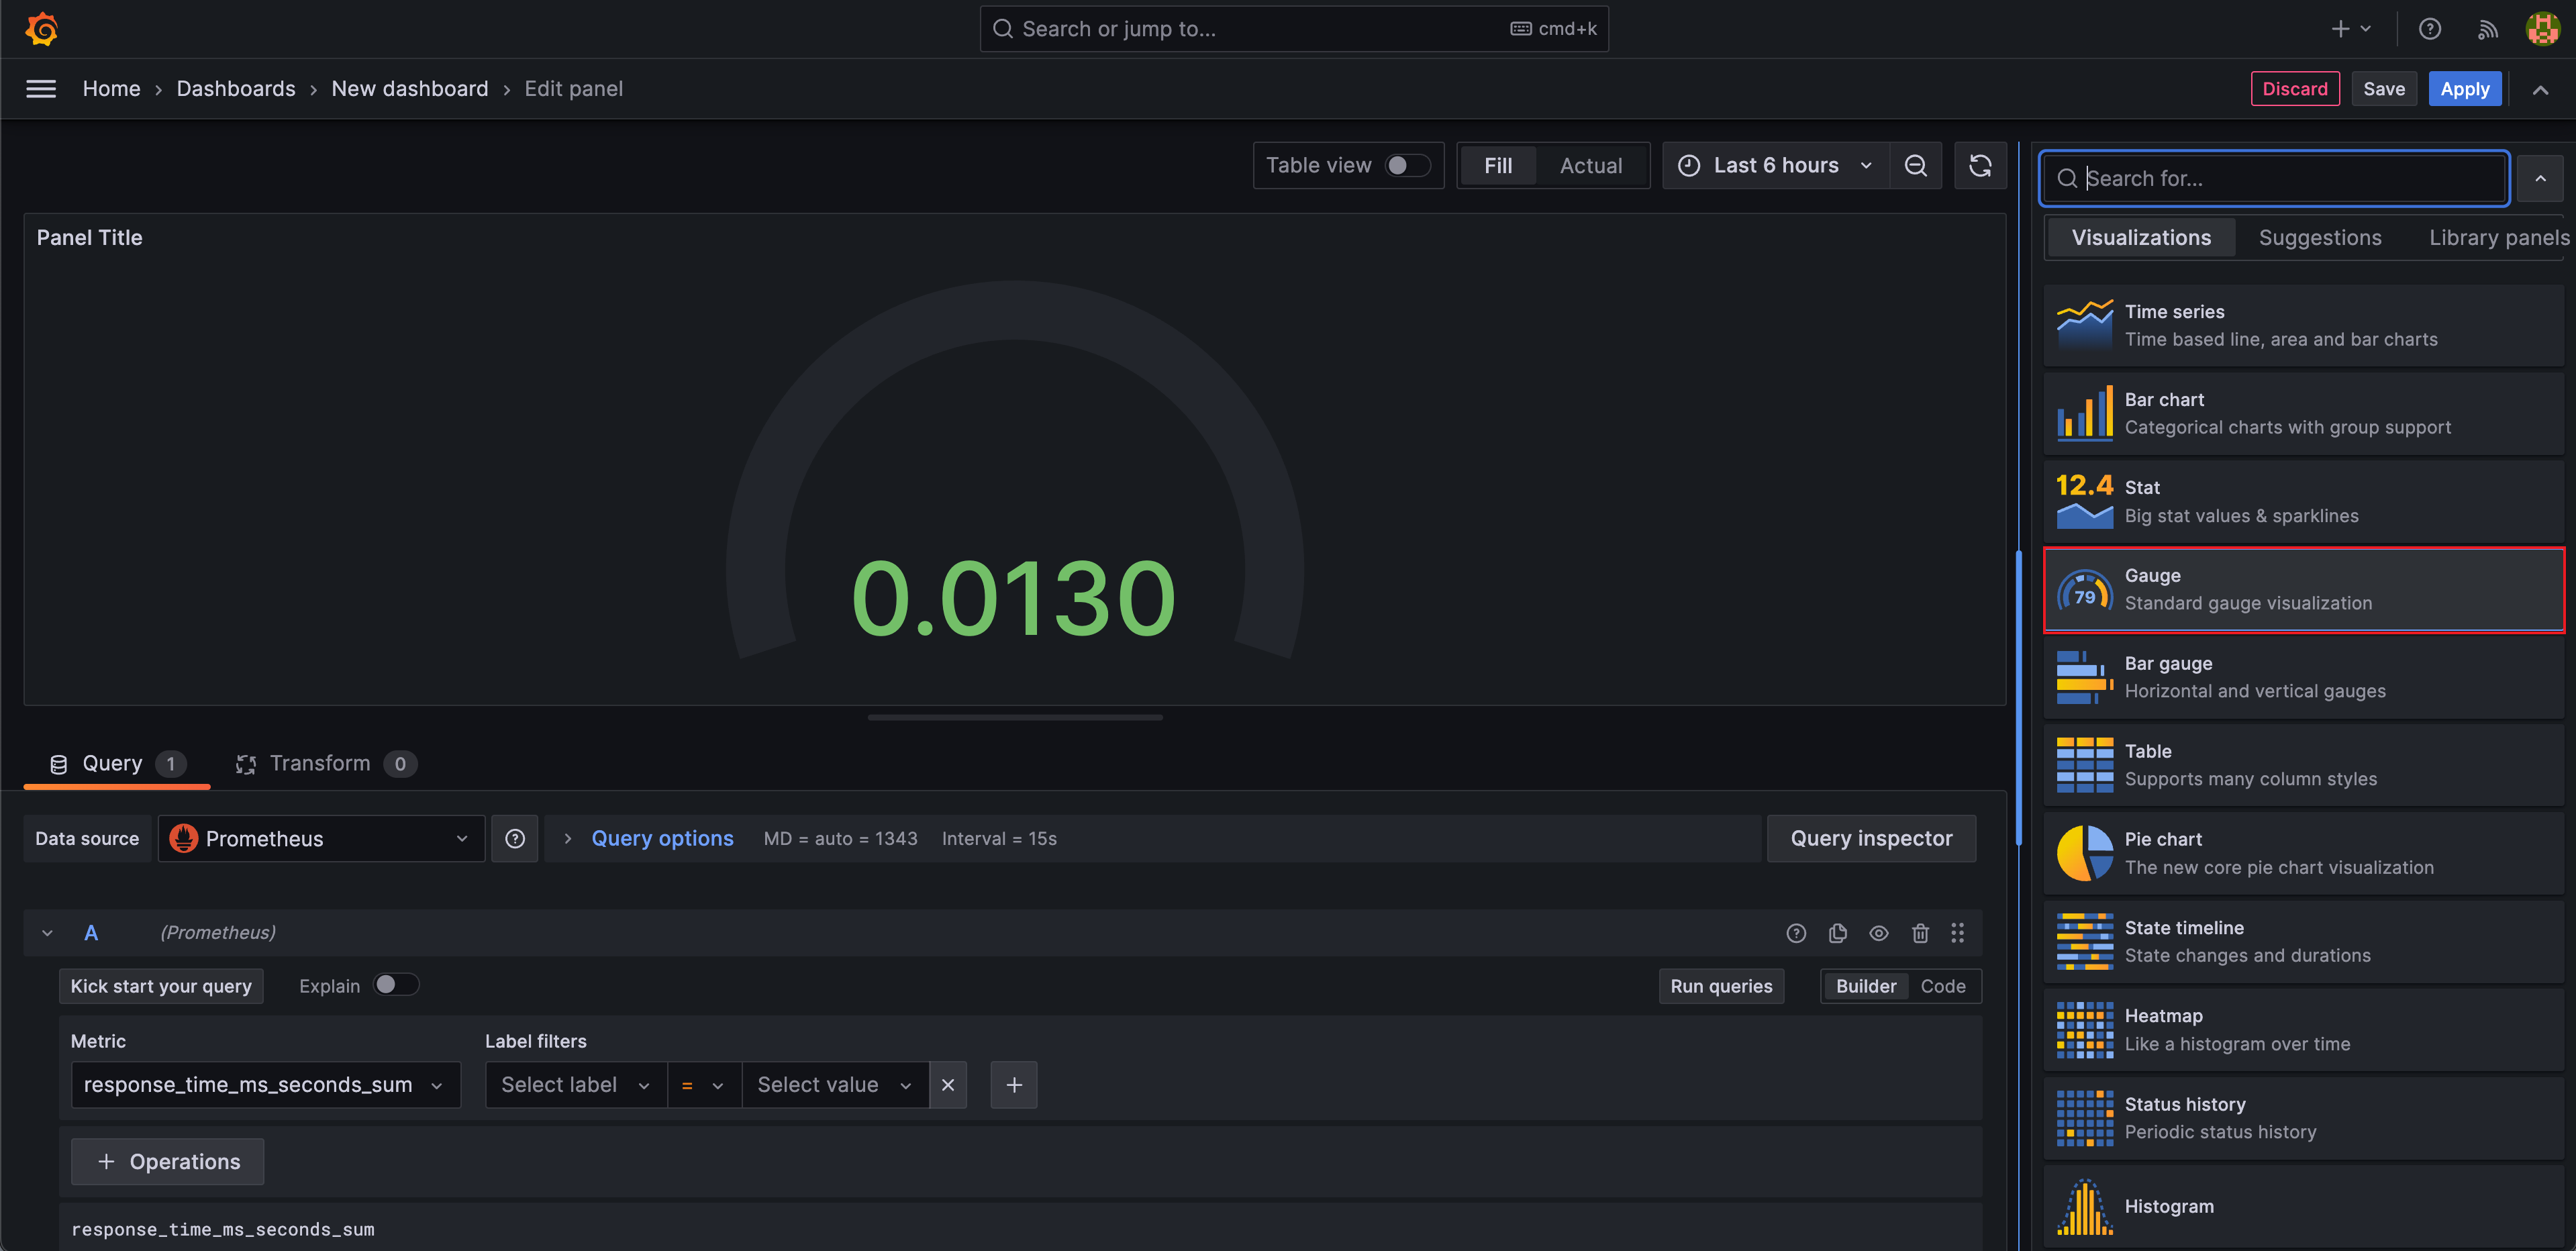
기본 값은 Metric의 마지막 값이 나타나므로 업데이트를 해줄 때마다 업데이트한 시점의 마지막 response time sum 값이 나타난다.
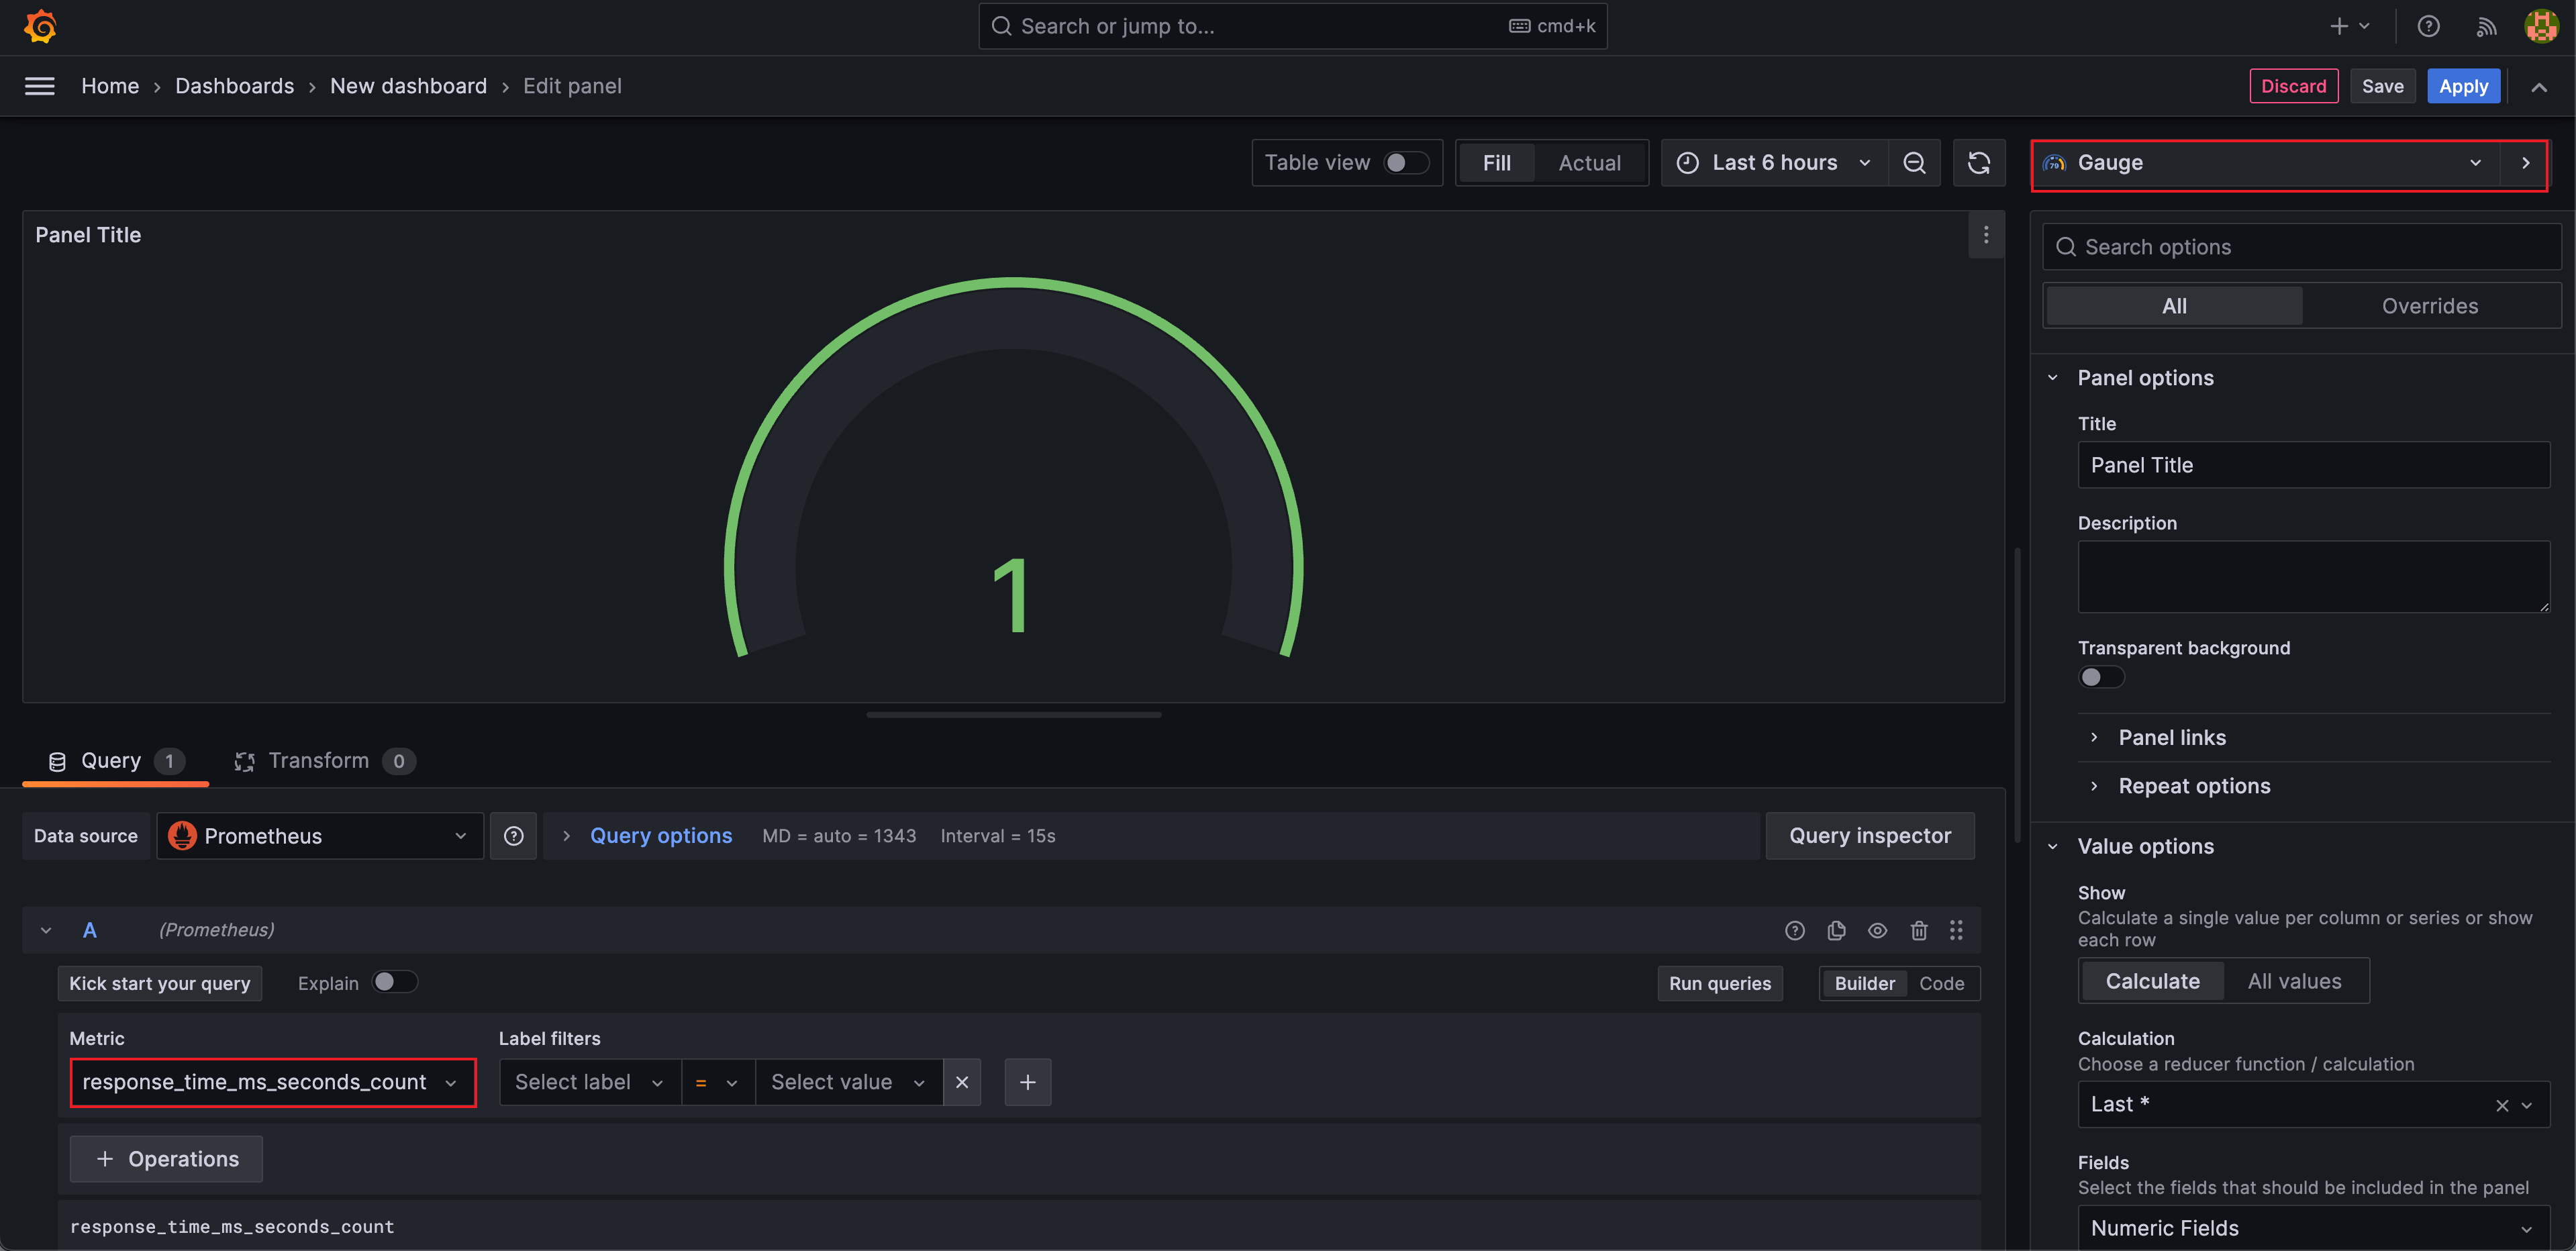
2. Response Time Count
Response Time Sum과 똑같이 Metric을 지정하고 Gauge 그래프로 설정해준다.
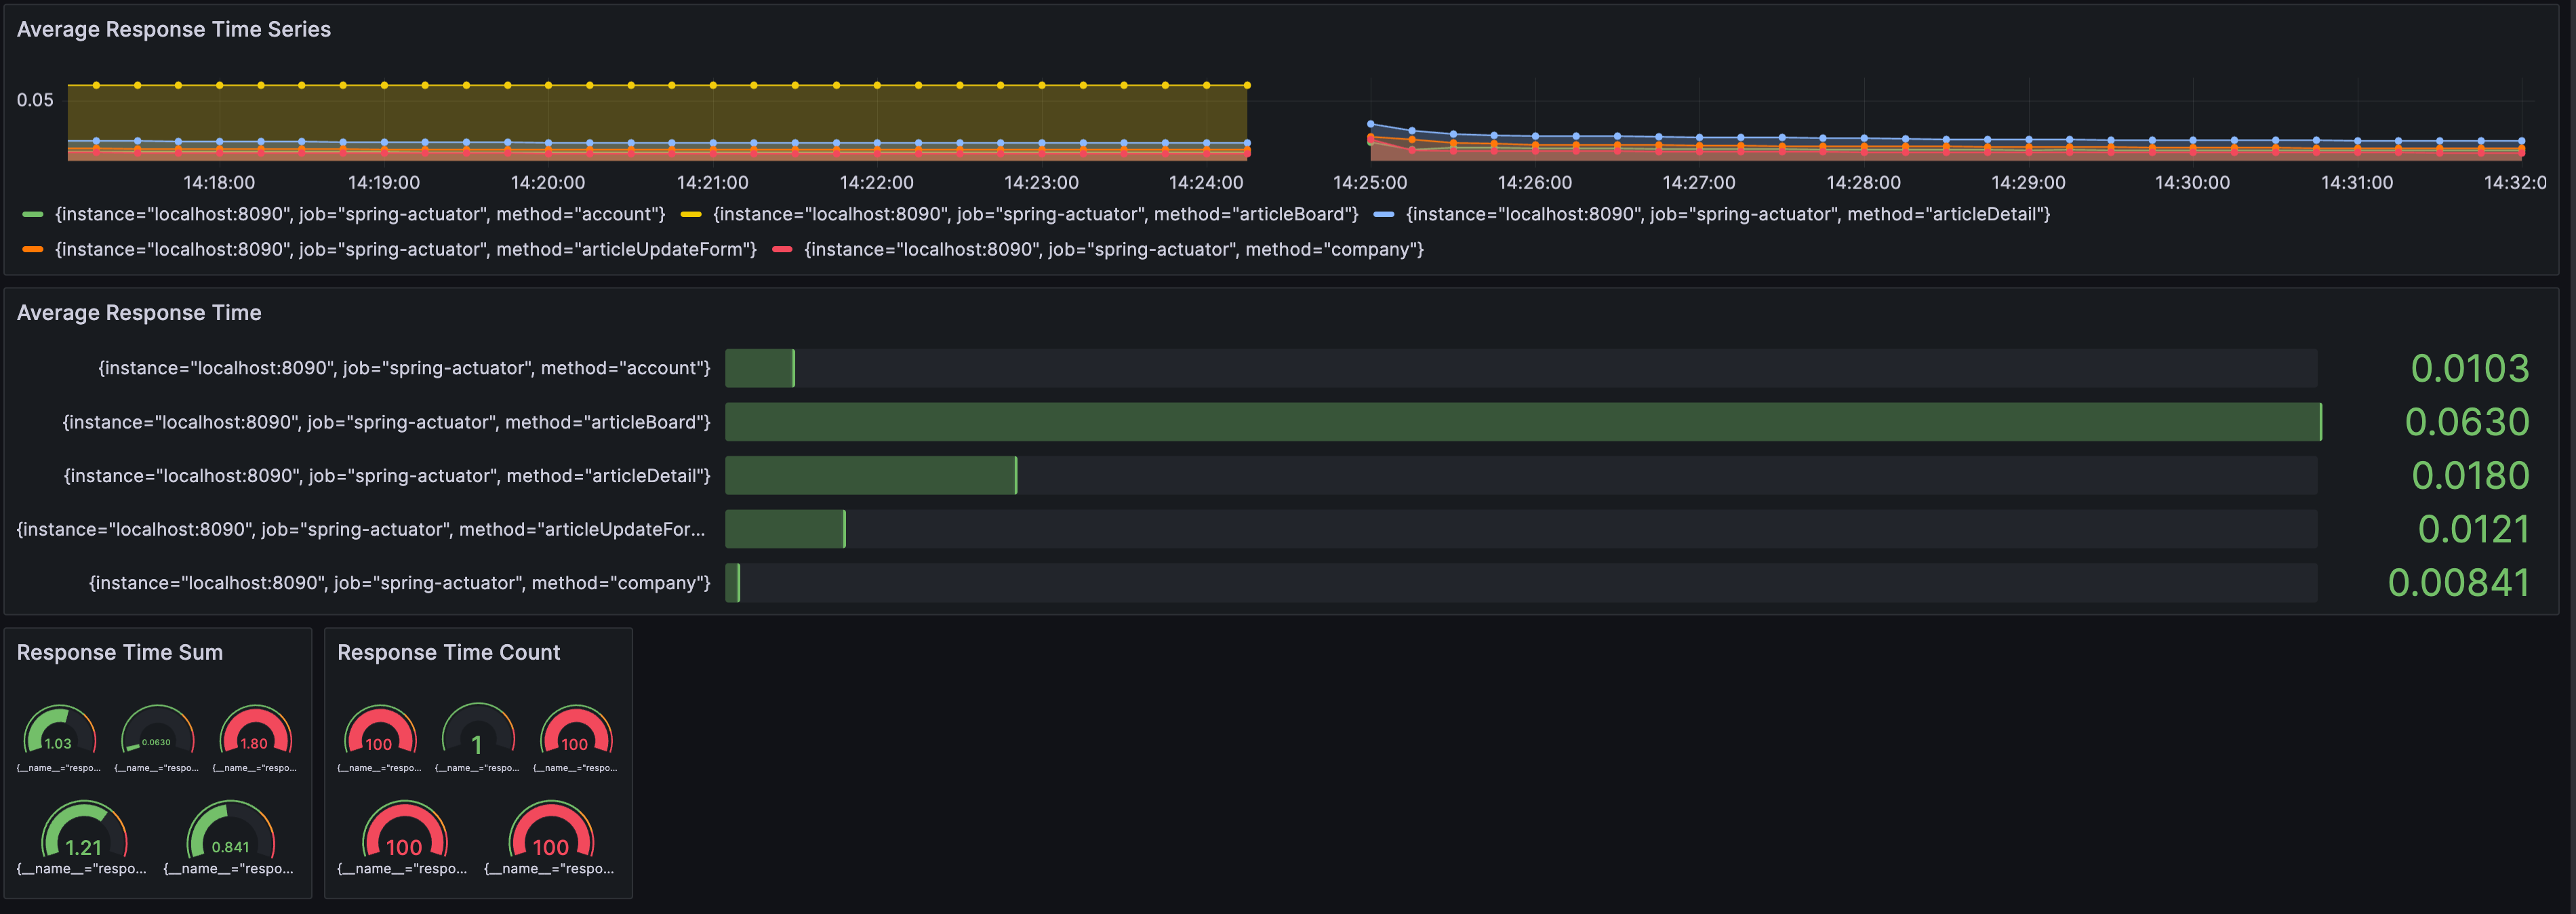
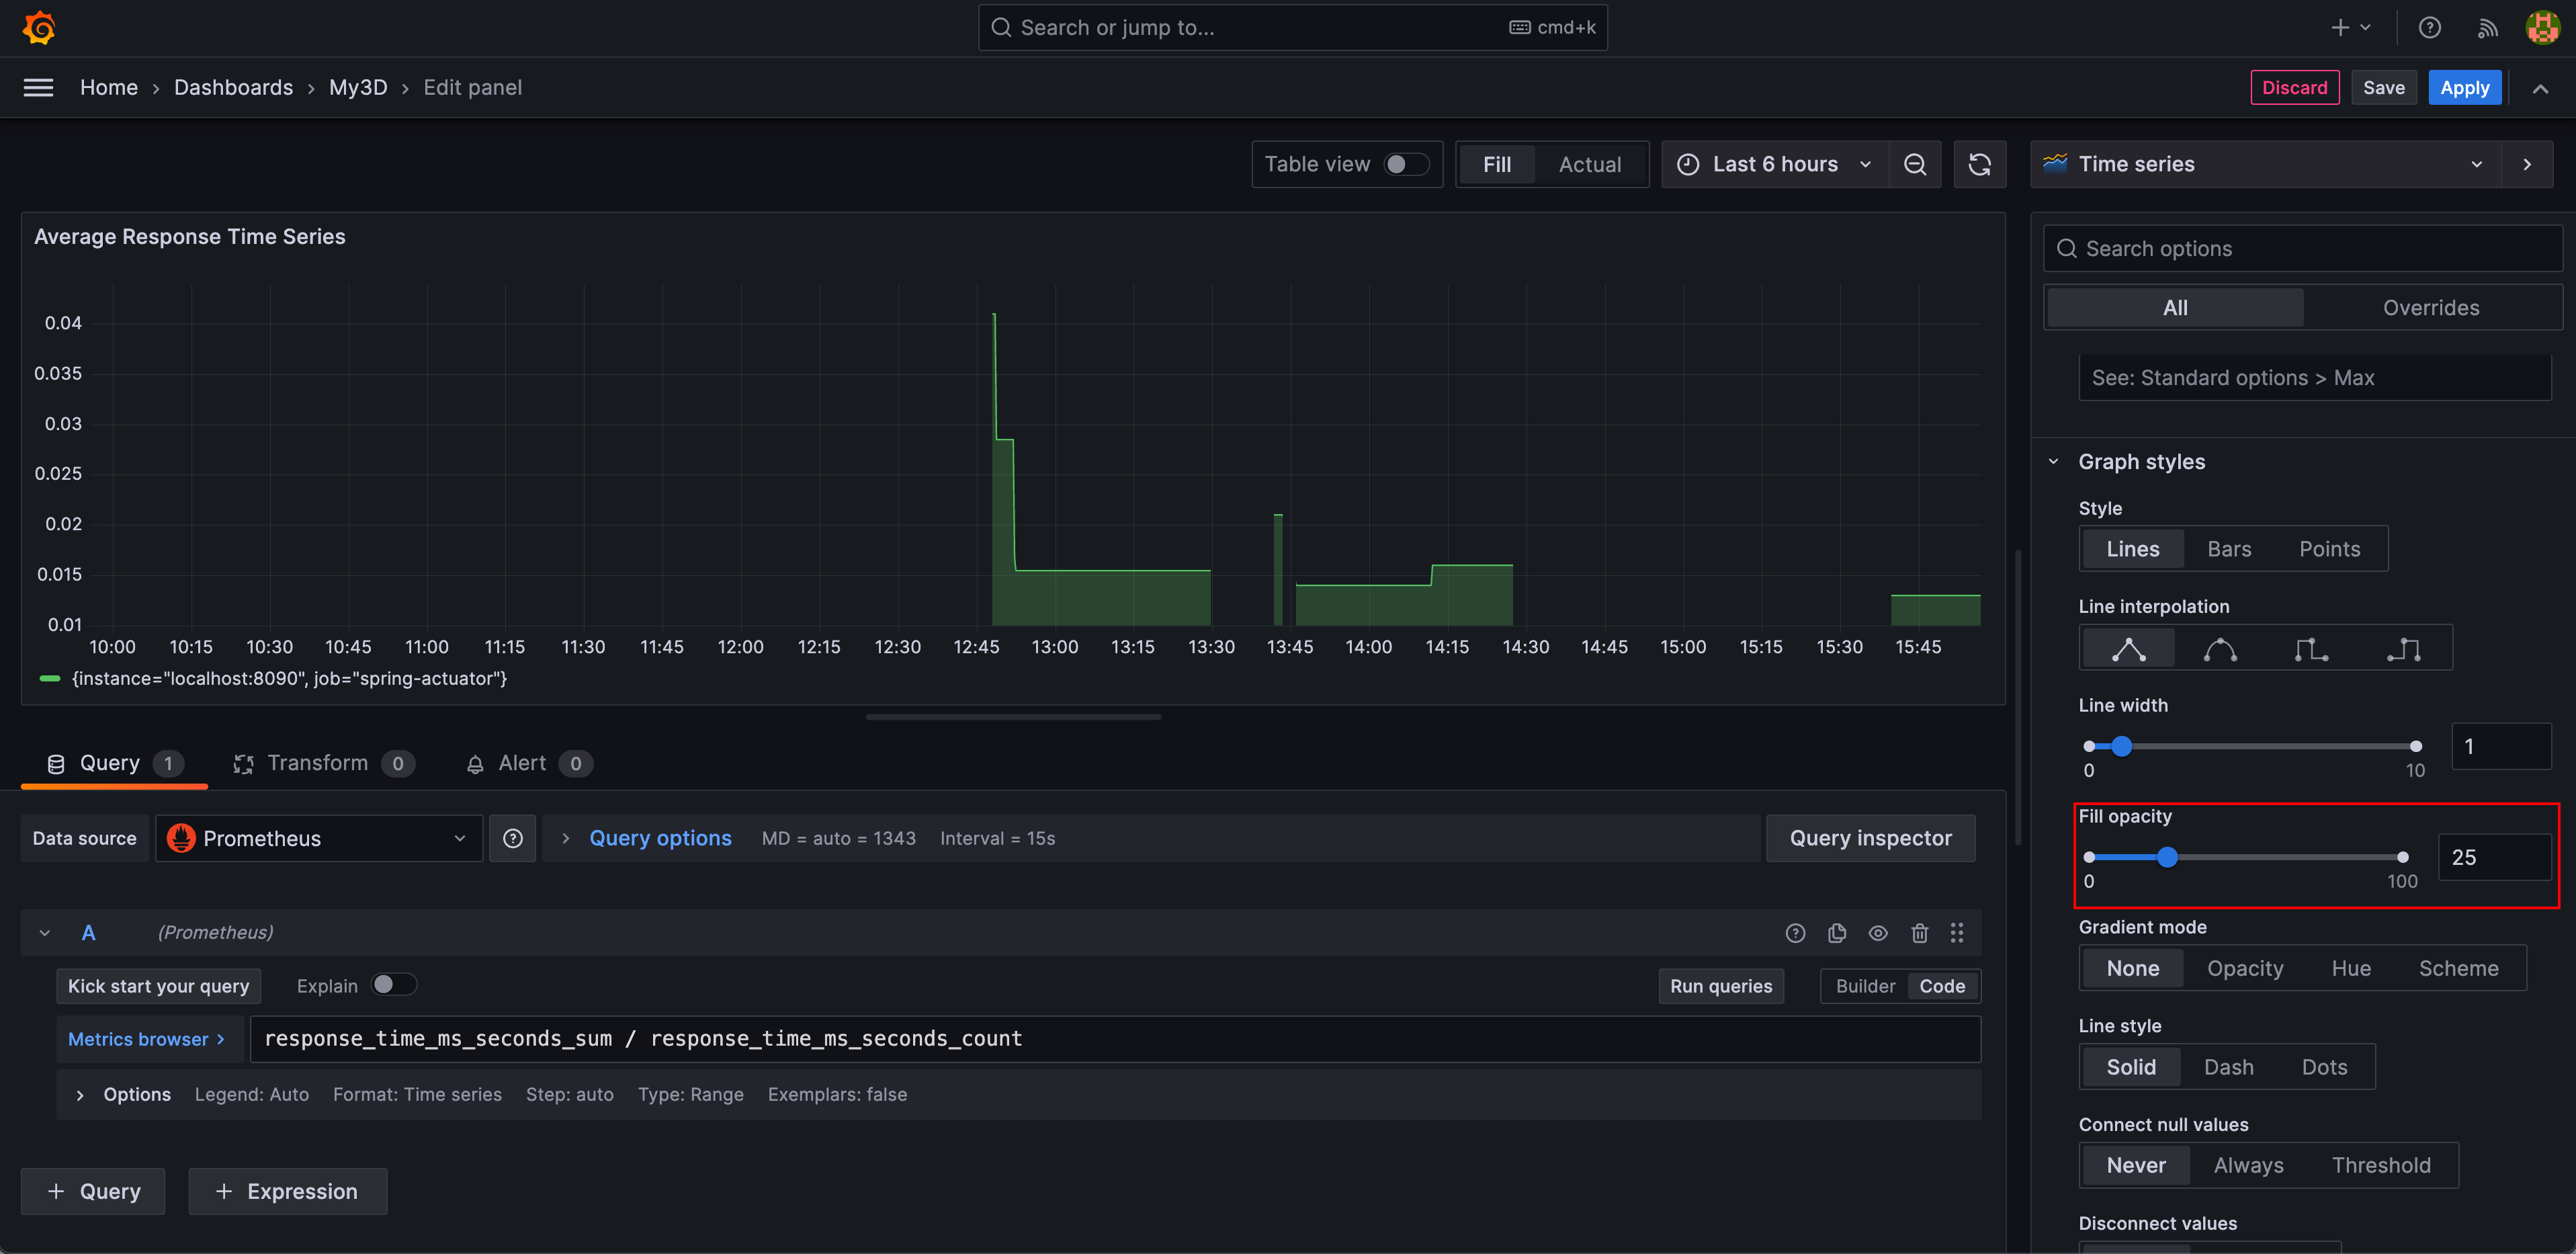
3. Average Response Time
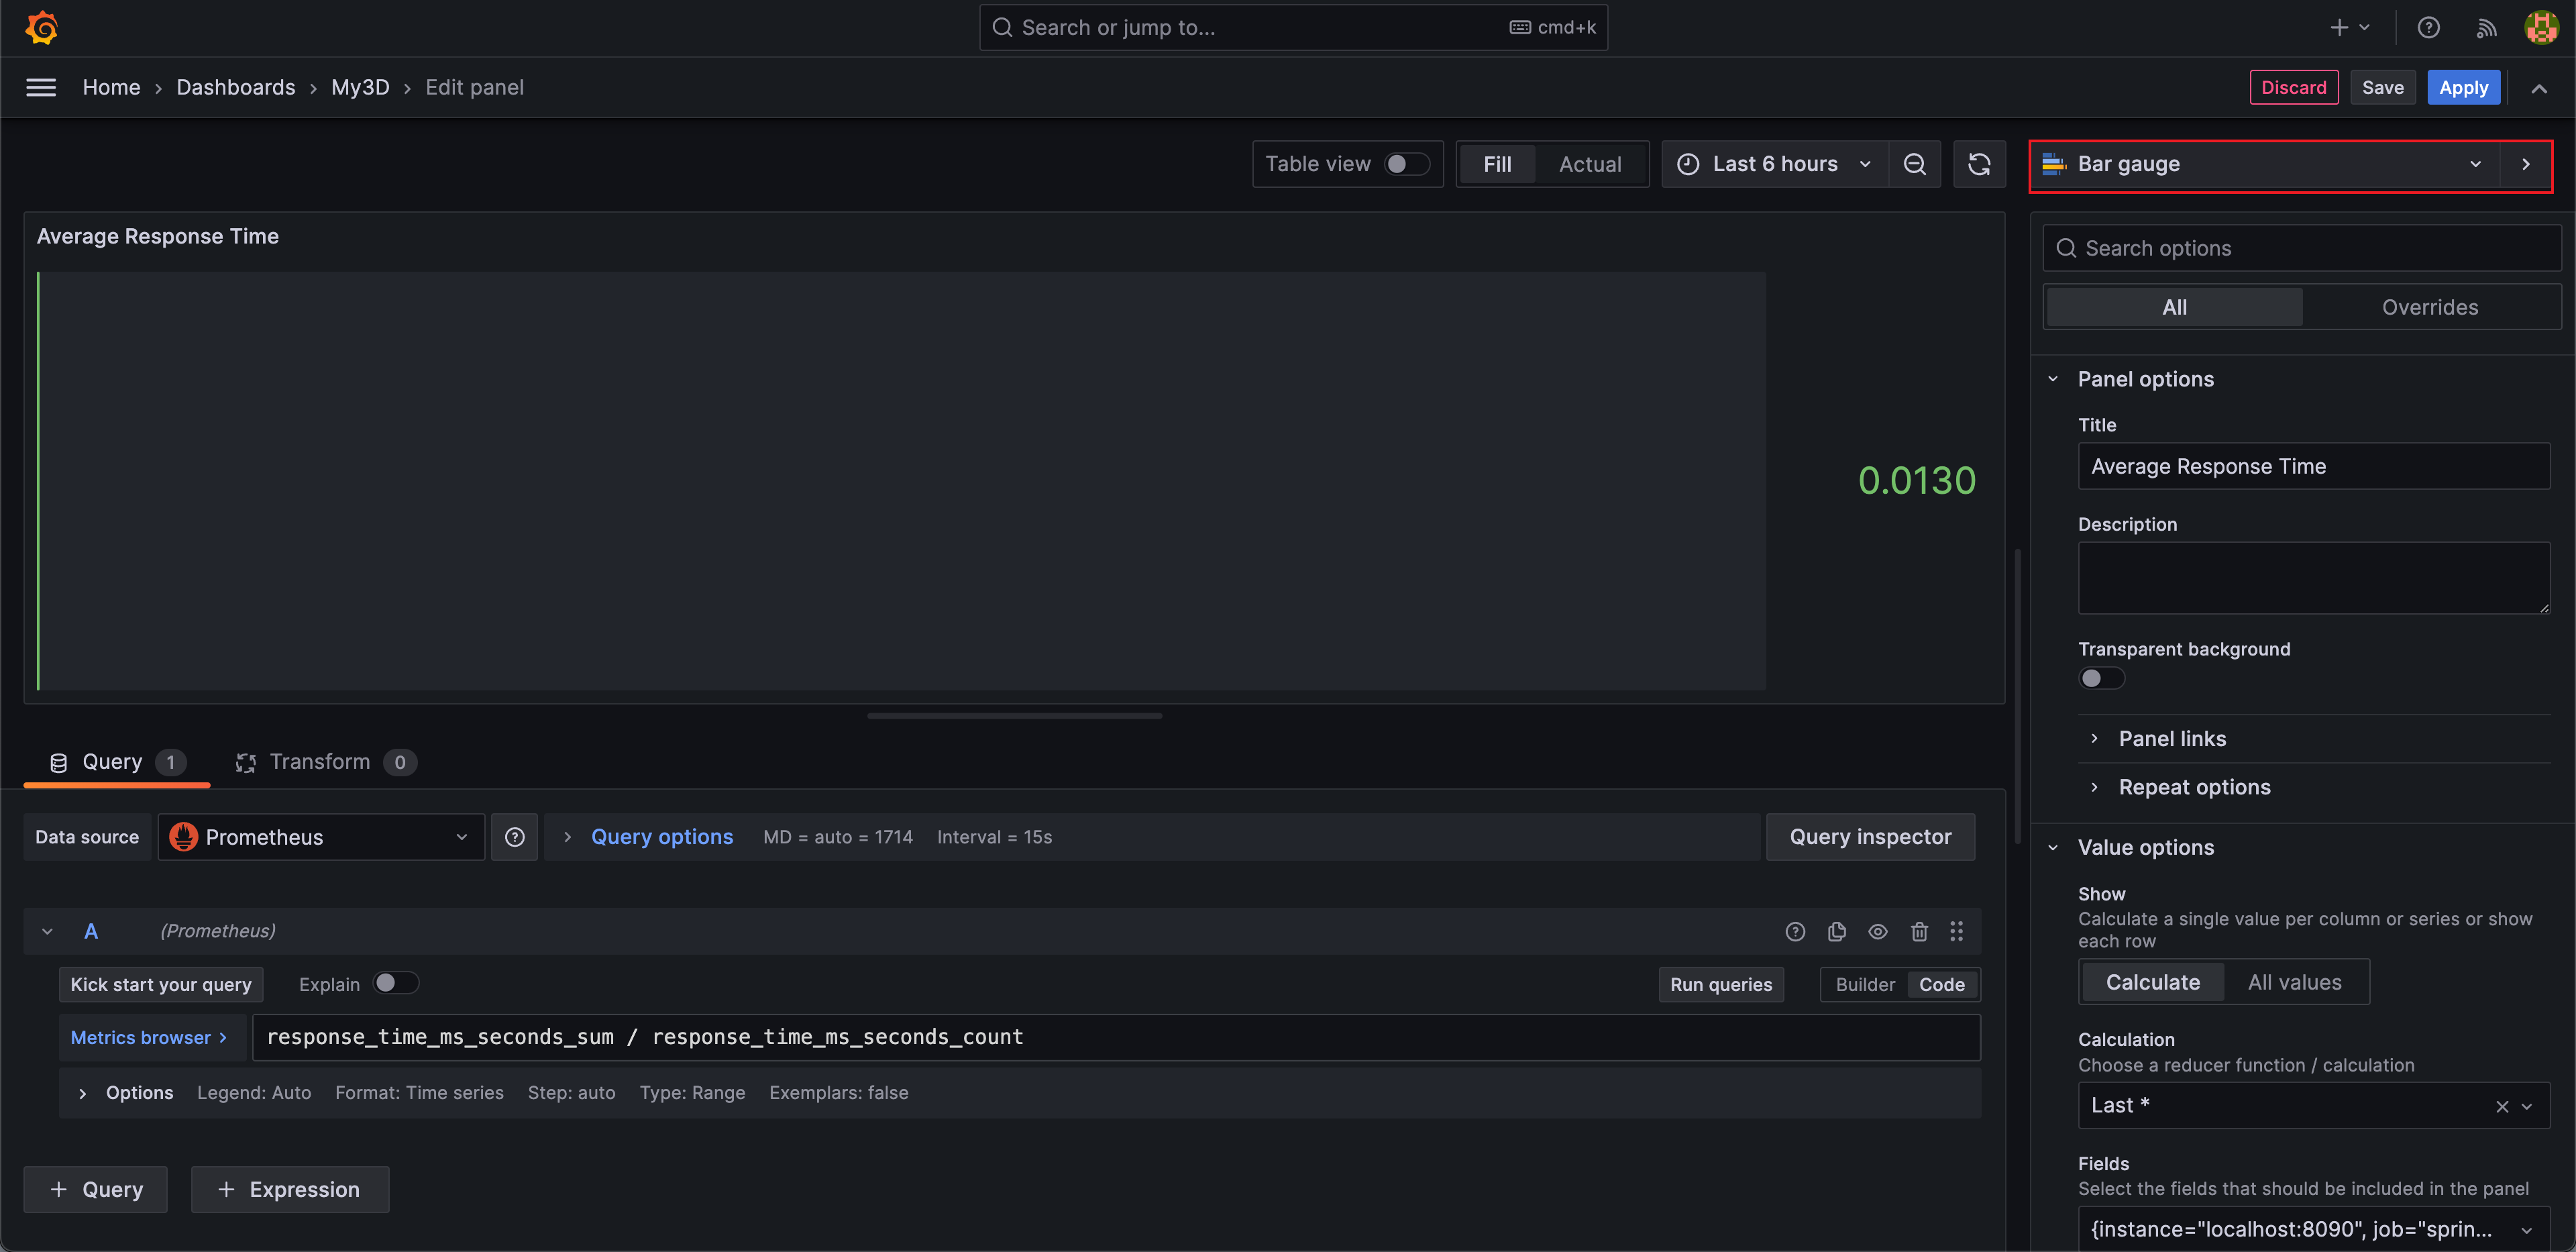
average response time에 대한 그래프를 추가해주기 위해서 직접 query를 추가해준다.
average response time의 경우 response time의 변화를 한눈에 파악하기 쉽도록 다음과 같이 Fill opacity를 설정해줄 수 있다.
또한 간단하게 최종 average response time만을 나타내기 위해 Bar gauge 그래프로 설정해줄 수 있다.